Cheyenne vs Colombian Master's Degree
COMPARE
Cheyenne
Colombian
Master's Degree
Master's Degree Comparison
Cheyenne
Colombians
11.2%
MASTER'S DEGREE
0.0/ 100
METRIC RATING
307th/ 347
METRIC RANK
15.3%
MASTER'S DEGREE
66.9/ 100
METRIC RATING
164th/ 347
METRIC RANK
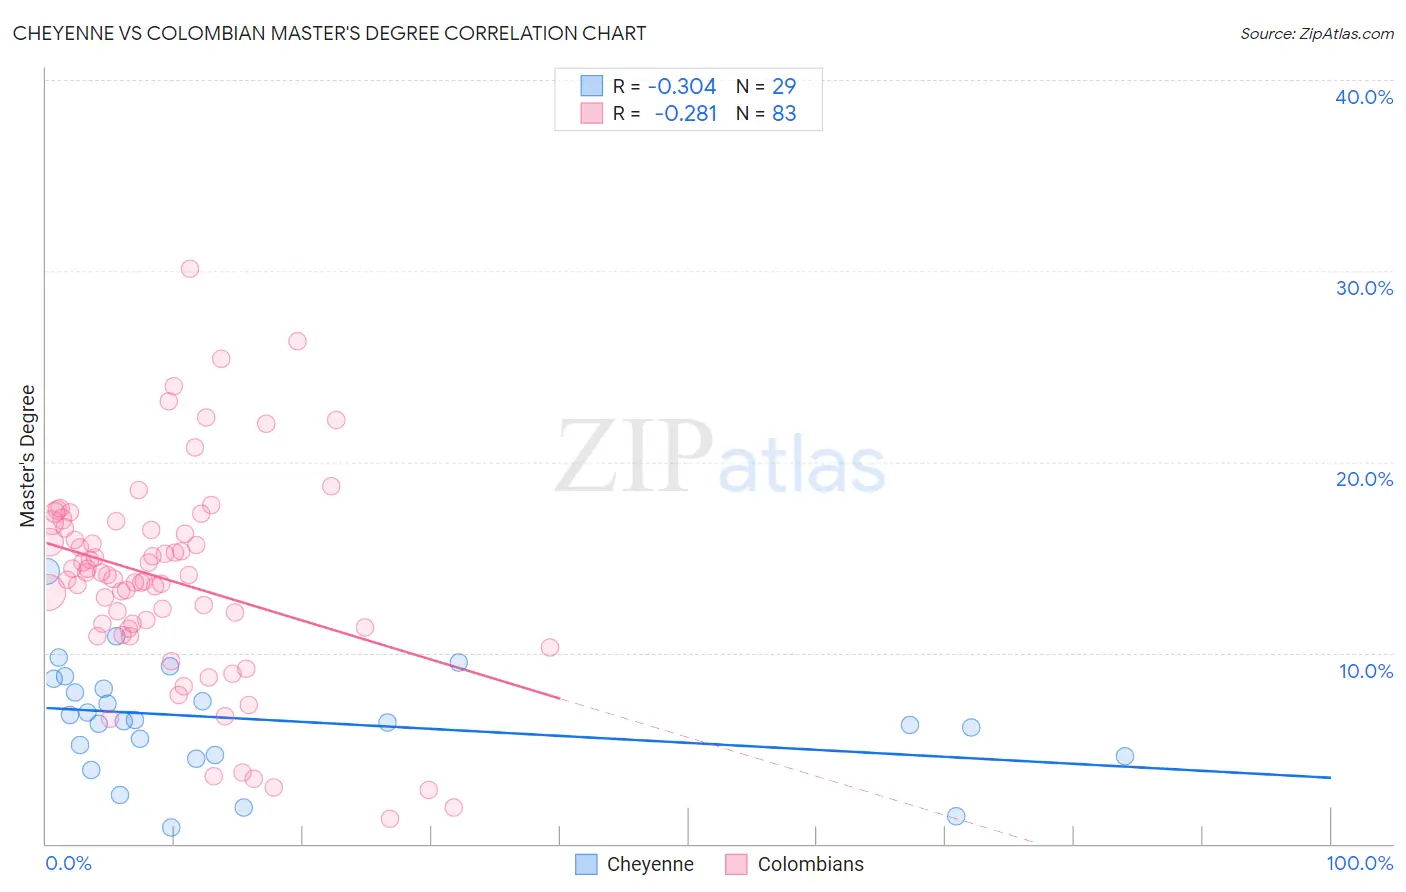
Cheyenne vs Colombian Master's Degree Correlation Chart
The statistical analysis conducted on geographies consisting of 80,705,312 people shows a mild negative correlation between the proportion of Cheyenne and percentage of population with at least master's degree education in the United States with a correlation coefficient (R) of -0.304 and weighted average of 11.2%. Similarly, the statistical analysis conducted on geographies consisting of 419,504,148 people shows a weak negative correlation between the proportion of Colombians and percentage of population with at least master's degree education in the United States with a correlation coefficient (R) of -0.281 and weighted average of 15.3%, a difference of 35.8%.
Master's Degree Correlation Summary
| Measurement | Cheyenne | Colombian |
| Minimum | 0.84% | 1.3% |
| Maximum | 14.3% | 30.1% |
| Range | 13.5% | 28.8% |
| Mean | 6.5% | 13.8% |
| Median | 6.4% | 14.1% |
| Interquartile 25% (IQ1) | 4.6% | 11.3% |
| Interquartile 75% (IQ3) | 8.4% | 16.5% |
| Interquartile Range (IQR) | 3.8% | 5.3% |
| Standard Deviation (Sample) | 2.9% | 5.5% |
| Standard Deviation (Population) | 2.9% | 5.4% |
Similar Demographics by Master's Degree
Demographics Similar to Cheyenne by Master's Degree
In terms of master's degree, the demographic groups most similar to Cheyenne are Mexican American Indian (11.2%, a difference of 0.15%), Immigrants from Latin America (11.3%, a difference of 0.34%), Puerto Rican (11.2%, a difference of 0.55%), Puget Sound Salish (11.1%, a difference of 0.84%), and Immigrants from Cabo Verde (11.3%, a difference of 0.99%).
| Demographics | Rating | Rank | Master's Degree |
| Chippewa | 0.1 /100 | #300 | Tragic 11.4% |
| Tsimshian | 0.1 /100 | #301 | Tragic 11.4% |
| Cherokee | 0.1 /100 | #302 | Tragic 11.4% |
| Immigrants | Laos | 0.1 /100 | #303 | Tragic 11.4% |
| Immigrants | Cabo Verde | 0.1 /100 | #304 | Tragic 11.3% |
| Immigrants | Latin America | 0.0 /100 | #305 | Tragic 11.3% |
| Mexican American Indians | 0.0 /100 | #306 | Tragic 11.2% |
| Cheyenne | 0.0 /100 | #307 | Tragic 11.2% |
| Puerto Ricans | 0.0 /100 | #308 | Tragic 11.2% |
| Puget Sound Salish | 0.0 /100 | #309 | Tragic 11.1% |
| Shoshone | 0.0 /100 | #310 | Tragic 11.1% |
| Seminole | 0.0 /100 | #311 | Tragic 11.0% |
| Choctaw | 0.0 /100 | #312 | Tragic 11.0% |
| Yaqui | 0.0 /100 | #313 | Tragic 11.0% |
| Cajuns | 0.0 /100 | #314 | Tragic 11.0% |
Demographics Similar to Colombians by Master's Degree
In terms of master's degree, the demographic groups most similar to Colombians are Uruguayan (15.3%, a difference of 0.030%), Immigrants from Kenya (15.3%, a difference of 0.040%), Swedish (15.2%, a difference of 0.11%), Senegalese (15.2%, a difference of 0.19%), and Peruvian (15.3%, a difference of 0.25%).
| Demographics | Rating | Rank | Master's Degree |
| Immigrants | Cameroon | 71.7 /100 | #157 | Good 15.4% |
| Immigrants | Poland | 71.5 /100 | #158 | Good 15.4% |
| Luxembourgers | 71.0 /100 | #159 | Good 15.3% |
| Kenyans | 70.3 /100 | #160 | Good 15.3% |
| Sudanese | 68.7 /100 | #161 | Good 15.3% |
| Peruvians | 68.7 /100 | #162 | Good 15.3% |
| Uruguayans | 67.1 /100 | #163 | Good 15.3% |
| Colombians | 66.9 /100 | #164 | Good 15.3% |
| Immigrants | Kenya | 66.6 /100 | #165 | Good 15.3% |
| Swedes | 66.1 /100 | #166 | Good 15.2% |
| Senegalese | 65.6 /100 | #167 | Good 15.2% |
| Immigrants | North Macedonia | 64.5 /100 | #168 | Good 15.2% |
| Scottish | 62.7 /100 | #169 | Good 15.2% |
| Irish | 56.3 /100 | #170 | Average 15.0% |
| Immigrants | Ghana | 53.6 /100 | #171 | Average 15.0% |