Nepalese vs Immigrants from Poland Nursery School
COMPARE
Nepalese
Immigrants from Poland
Nursery School
Nursery School Comparison
Nepalese
Immigrants from Poland
96.2%
NURSERY SCHOOL
0.0/ 100
METRIC RATING
345th/ 347
METRIC RANK
98.0%
NURSERY SCHOOL
41.3/ 100
METRIC RATING
184th/ 347
METRIC RANK
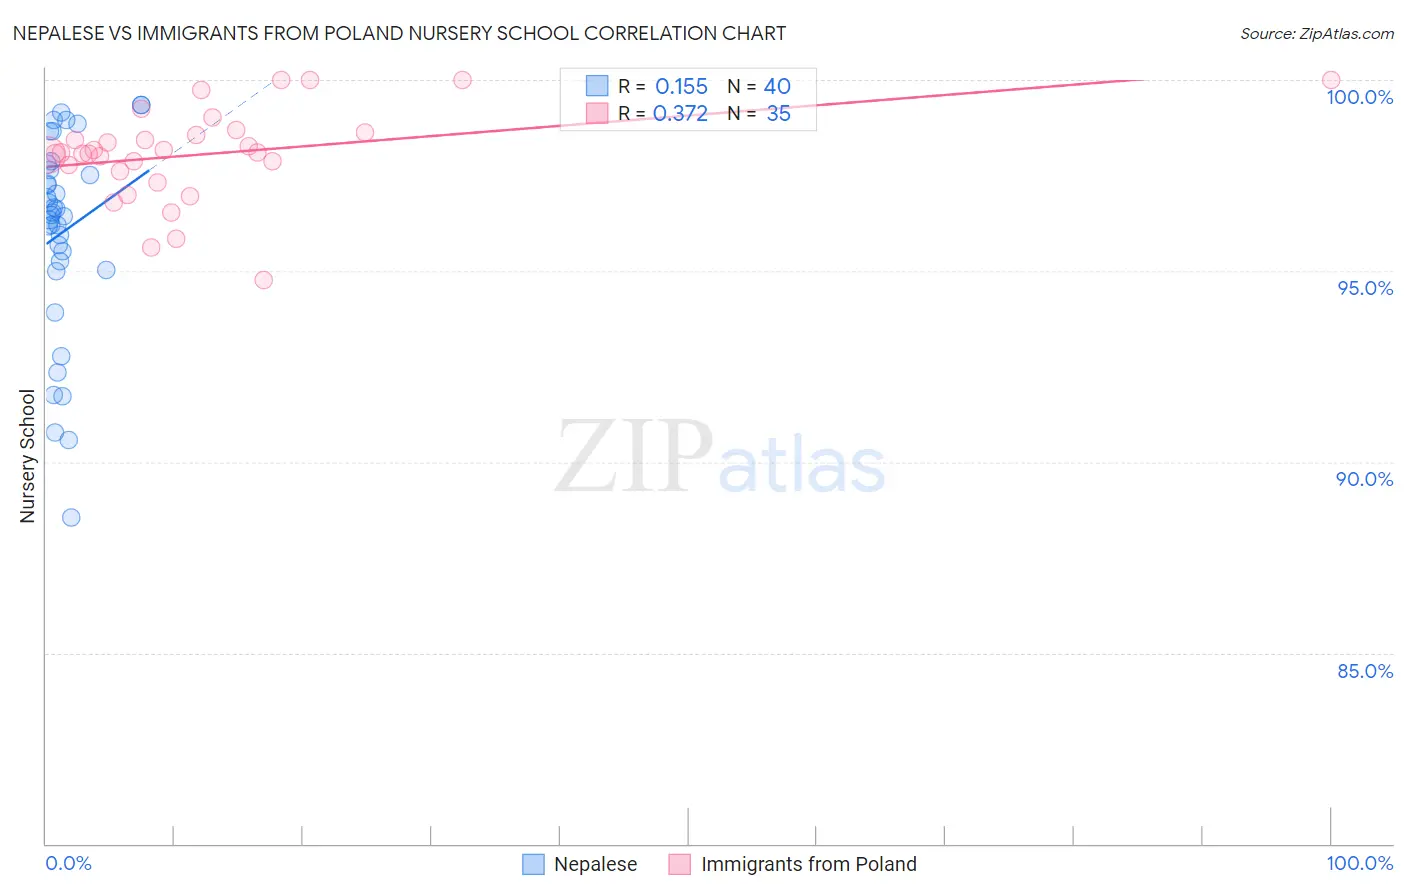
Nepalese vs Immigrants from Poland Nursery School Correlation Chart
The statistical analysis conducted on geographies consisting of 24,521,755 people shows a poor positive correlation between the proportion of Nepalese and percentage of population with at least nursery school education in the United States with a correlation coefficient (R) of 0.155 and weighted average of 96.2%. Similarly, the statistical analysis conducted on geographies consisting of 304,861,559 people shows a mild positive correlation between the proportion of Immigrants from Poland and percentage of population with at least nursery school education in the United States with a correlation coefficient (R) of 0.372 and weighted average of 98.0%, a difference of 1.8%.
Nursery School Correlation Summary
| Measurement | Nepalese | Immigrants from Poland |
| Minimum | 88.5% | 94.8% |
| Maximum | 99.3% | 100.0% |
| Range | 10.8% | 5.2% |
| Mean | 96.0% | 98.1% |
| Median | 96.5% | 98.1% |
| Interquartile 25% (IQ1) | 95.1% | 97.6% |
| Interquartile 75% (IQ3) | 97.7% | 98.6% |
| Interquartile Range (IQR) | 2.6% | 1.0% |
| Standard Deviation (Sample) | 2.6% | 1.2% |
| Standard Deviation (Population) | 2.6% | 1.2% |
Similar Demographics by Nursery School
Demographics Similar to Nepalese by Nursery School
In terms of nursery school, the demographic groups most similar to Nepalese are Immigrants from El Salvador (96.2%, a difference of 0.010%), Salvadoran (96.4%, a difference of 0.16%), Immigrants from Mexico (96.4%, a difference of 0.19%), Immigrants from Cabo Verde (96.4%, a difference of 0.20%), and Immigrants from Central America (96.4%, a difference of 0.22%).
| Demographics | Rating | Rank | Nursery School |
| Central Americans | 0.0 /100 | #333 | Tragic 96.6% |
| Immigrants | Dominican Republic | 0.0 /100 | #334 | Tragic 96.6% |
| Bangladeshis | 0.0 /100 | #335 | Tragic 96.6% |
| Guatemalans | 0.0 /100 | #336 | Tragic 96.6% |
| Immigrants | Cambodia | 0.0 /100 | #337 | Tragic 96.5% |
| Immigrants | Fiji | 0.0 /100 | #338 | Tragic 96.5% |
| Immigrants | Guatemala | 0.0 /100 | #339 | Tragic 96.4% |
| Immigrants | Central America | 0.0 /100 | #340 | Tragic 96.4% |
| Immigrants | Cabo Verde | 0.0 /100 | #341 | Tragic 96.4% |
| Immigrants | Mexico | 0.0 /100 | #342 | Tragic 96.4% |
| Salvadorans | 0.0 /100 | #343 | Tragic 96.4% |
| Immigrants | El Salvador | 0.0 /100 | #344 | Tragic 96.2% |
| Nepalese | 0.0 /100 | #345 | Tragic 96.2% |
| Immigrants | Yemen | 0.0 /100 | #346 | Tragic 95.9% |
| Spanish American Indians | 0.0 /100 | #347 | Tragic 95.8% |
Demographics Similar to Immigrants from Poland by Nursery School
In terms of nursery school, the demographic groups most similar to Immigrants from Poland are Egyptian (98.0%, a difference of 0.0%), Paiute (98.0%, a difference of 0.0%), Portuguese (98.0%, a difference of 0.0%), Immigrants from Belarus (98.0%, a difference of 0.0%), and Immigrants from Argentina (98.0%, a difference of 0.0%).
| Demographics | Rating | Rank | Nursery School |
| Albanians | 48.9 /100 | #177 | Average 98.0% |
| Natives/Alaskans | 48.6 /100 | #178 | Average 98.0% |
| Argentineans | 46.8 /100 | #179 | Average 98.0% |
| Immigrants | Bosnia and Herzegovina | 45.6 /100 | #180 | Average 98.0% |
| Egyptians | 42.8 /100 | #181 | Average 98.0% |
| Paiute | 42.0 /100 | #182 | Average 98.0% |
| Portuguese | 41.8 /100 | #183 | Average 98.0% |
| Immigrants | Poland | 41.3 /100 | #184 | Average 98.0% |
| Immigrants | Belarus | 41.0 /100 | #185 | Average 98.0% |
| Immigrants | Argentina | 40.8 /100 | #186 | Average 98.0% |
| Immigrants | Kazakhstan | 37.1 /100 | #187 | Fair 97.9% |
| Arabs | 34.7 /100 | #188 | Fair 97.9% |
| Pakistanis | 34.6 /100 | #189 | Fair 97.9% |
| Panamanians | 34.3 /100 | #190 | Fair 97.9% |
| Immigrants | Taiwan | 30.6 /100 | #191 | Fair 97.9% |