Cherokee vs Sri Lankan High School Diploma
COMPARE
Cherokee
Sri Lankan
High School Diploma
High School Diploma Comparison
Cherokee
Sri Lankans
88.5%
HIGH SCHOOL DIPLOMA
14.3/ 100
METRIC RATING
209th/ 347
METRIC RANK
87.0%
HIGH SCHOOL DIPLOMA
0.2/ 100
METRIC RATING
269th/ 347
METRIC RANK
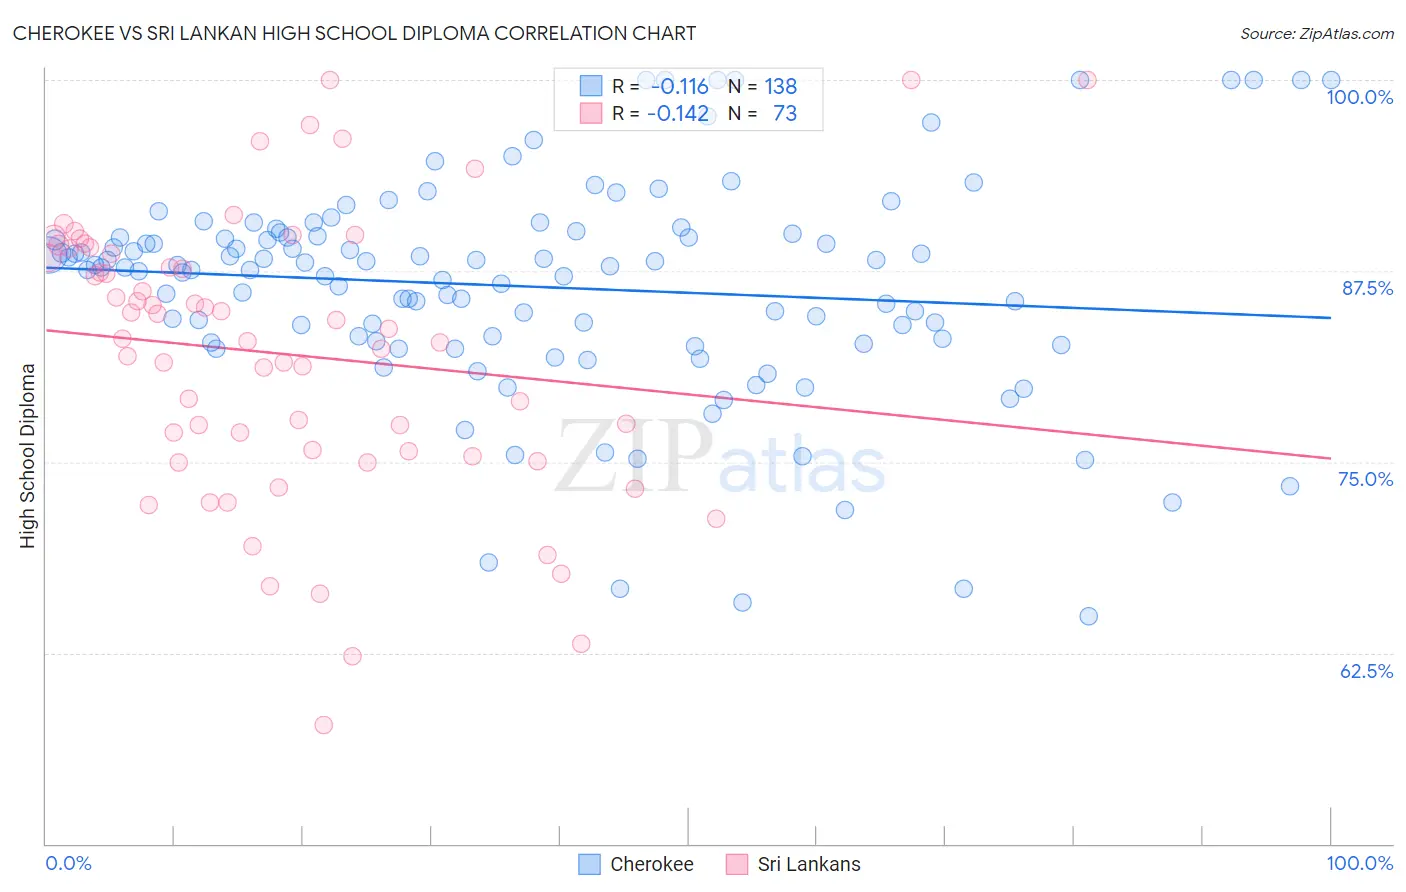
Cherokee vs Sri Lankan High School Diploma Correlation Chart
The statistical analysis conducted on geographies consisting of 493,720,047 people shows a poor negative correlation between the proportion of Cherokee and percentage of population with at least high school diploma education in the United States with a correlation coefficient (R) of -0.116 and weighted average of 88.5%. Similarly, the statistical analysis conducted on geographies consisting of 440,593,537 people shows a poor negative correlation between the proportion of Sri Lankans and percentage of population with at least high school diploma education in the United States with a correlation coefficient (R) of -0.142 and weighted average of 87.0%, a difference of 1.8%.
High School Diploma Correlation Summary
| Measurement | Cherokee | Sri Lankan |
| Minimum | 64.9% | 57.8% |
| Maximum | 100.0% | 100.0% |
| Range | 35.1% | 42.2% |
| Mean | 86.5% | 82.1% |
| Median | 87.7% | 83.1% |
| Interquartile 25% (IQ1) | 82.9% | 75.5% |
| Interquartile 75% (IQ3) | 89.7% | 88.8% |
| Interquartile Range (IQR) | 6.9% | 13.3% |
| Standard Deviation (Sample) | 7.1% | 9.2% |
| Standard Deviation (Population) | 7.0% | 9.1% |
Similar Demographics by High School Diploma
Demographics Similar to Cherokee by High School Diploma
In terms of high school diploma, the demographic groups most similar to Cherokee are Portuguese (88.5%, a difference of 0.0%), Samoan (88.5%, a difference of 0.010%), Immigrants from Sierra Leone (88.6%, a difference of 0.040%), Inupiat (88.5%, a difference of 0.040%), and Arapaho (88.6%, a difference of 0.050%).
| Demographics | Rating | Rank | High School Diploma |
| Panamanians | 18.0 /100 | #202 | Poor 88.6% |
| Somalis | 17.5 /100 | #203 | Poor 88.6% |
| Armenians | 17.2 /100 | #204 | Poor 88.6% |
| Immigrants | Micronesia | 16.4 /100 | #205 | Poor 88.6% |
| Arapaho | 16.1 /100 | #206 | Poor 88.6% |
| Immigrants | Sierra Leone | 15.8 /100 | #207 | Poor 88.6% |
| Portuguese | 14.4 /100 | #208 | Poor 88.5% |
| Cherokee | 14.3 /100 | #209 | Poor 88.5% |
| Samoans | 14.0 /100 | #210 | Poor 88.5% |
| Inupiat | 13.1 /100 | #211 | Poor 88.5% |
| South American Indians | 12.2 /100 | #212 | Poor 88.5% |
| Immigrants | Somalia | 11.3 /100 | #213 | Poor 88.4% |
| Immigrants | Cameroon | 10.9 /100 | #214 | Poor 88.4% |
| Crow | 10.9 /100 | #215 | Poor 88.4% |
| Chickasaw | 10.7 /100 | #216 | Poor 88.4% |
Demographics Similar to Sri Lankans by High School Diploma
In terms of high school diploma, the demographic groups most similar to Sri Lankans are Pennsylvania German (87.0%, a difference of 0.010%), Malaysian (87.0%, a difference of 0.010%), Black/African American (87.0%, a difference of 0.040%), Immigrants from Congo (87.0%, a difference of 0.050%), and West Indian (86.9%, a difference of 0.080%).
| Demographics | Rating | Rank | High School Diploma |
| Immigrants | Peru | 0.4 /100 | #262 | Tragic 87.3% |
| Immigrants | South Eastern Asia | 0.3 /100 | #263 | Tragic 87.2% |
| Jamaicans | 0.3 /100 | #264 | Tragic 87.2% |
| U.S. Virgin Islanders | 0.2 /100 | #265 | Tragic 87.1% |
| Immigrants | Congo | 0.2 /100 | #266 | Tragic 87.0% |
| Blacks/African Americans | 0.2 /100 | #267 | Tragic 87.0% |
| Pennsylvania Germans | 0.2 /100 | #268 | Tragic 87.0% |
| Sri Lankans | 0.2 /100 | #269 | Tragic 87.0% |
| Malaysians | 0.2 /100 | #270 | Tragic 87.0% |
| West Indians | 0.1 /100 | #271 | Tragic 86.9% |
| Trinidadians and Tobagonians | 0.1 /100 | #272 | Tragic 86.9% |
| Immigrants | Jamaica | 0.1 /100 | #273 | Tragic 86.9% |
| Bangladeshis | 0.1 /100 | #274 | Tragic 86.9% |
| Immigrants | Trinidad and Tobago | 0.1 /100 | #275 | Tragic 86.8% |
| Immigrants | Burma/Myanmar | 0.1 /100 | #276 | Tragic 86.7% |