Cherokee vs Immigrants from Central America High School Diploma
COMPARE
Cherokee
Immigrants from Central America
High School Diploma
High School Diploma Comparison
Cherokee
Immigrants from Central America
88.5%
HIGH SCHOOL DIPLOMA
14.3/ 100
METRIC RATING
209th/ 347
METRIC RANK
80.1%
HIGH SCHOOL DIPLOMA
0.0/ 100
METRIC RATING
344th/ 347
METRIC RANK
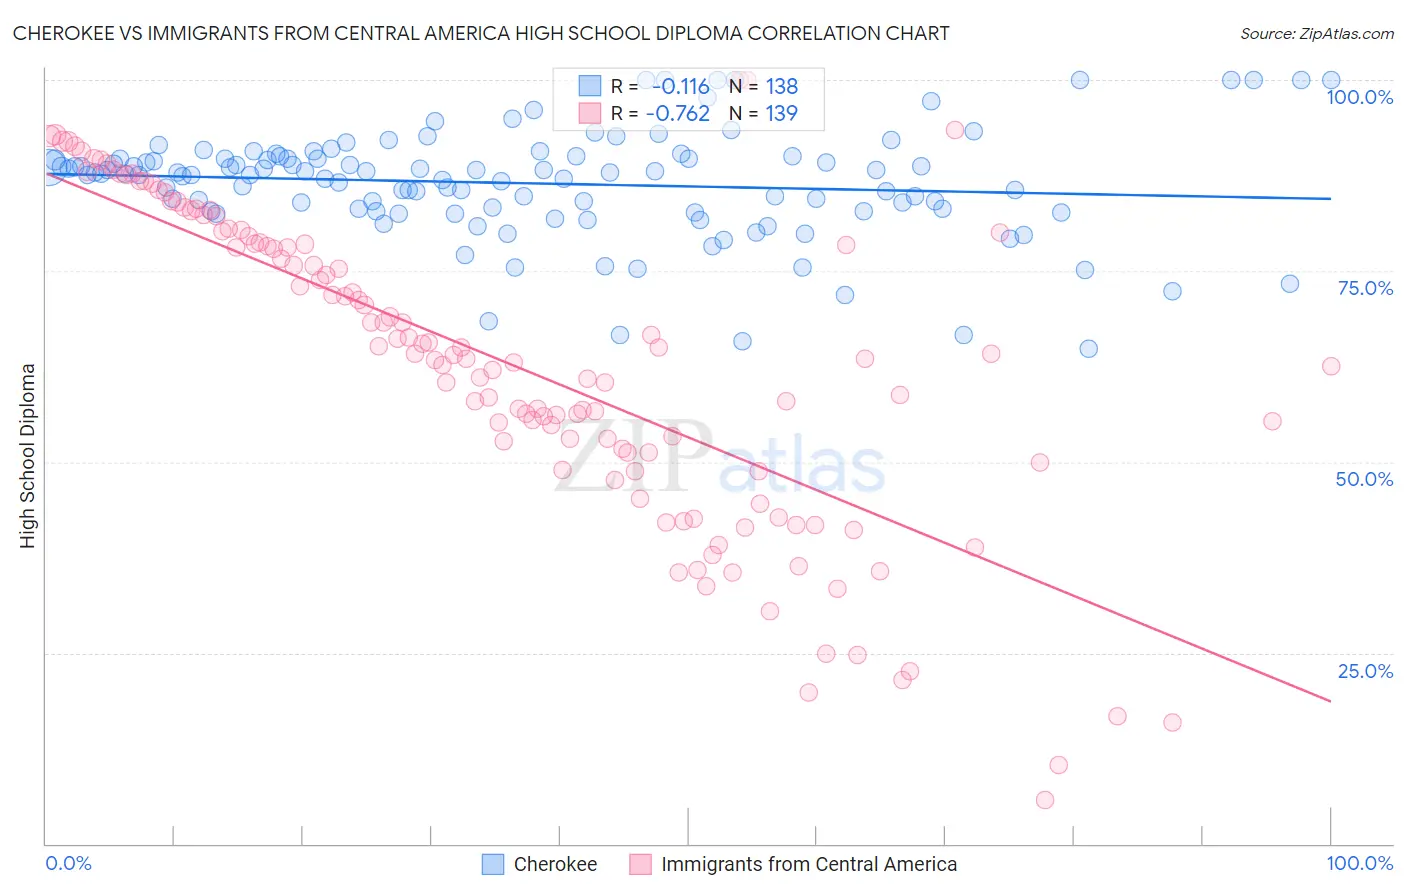
Cherokee vs Immigrants from Central America High School Diploma Correlation Chart
The statistical analysis conducted on geographies consisting of 493,720,047 people shows a poor negative correlation between the proportion of Cherokee and percentage of population with at least high school diploma education in the United States with a correlation coefficient (R) of -0.116 and weighted average of 88.5%. Similarly, the statistical analysis conducted on geographies consisting of 536,552,458 people shows a strong negative correlation between the proportion of Immigrants from Central America and percentage of population with at least high school diploma education in the United States with a correlation coefficient (R) of -0.762 and weighted average of 80.1%, a difference of 10.5%.
High School Diploma Correlation Summary
| Measurement | Cherokee | Immigrants from Central America |
| Minimum | 64.9% | 5.7% |
| Maximum | 100.0% | 100.0% |
| Range | 35.1% | 94.3% |
| Mean | 86.5% | 62.8% |
| Median | 87.7% | 64.1% |
| Interquartile 25% (IQ1) | 82.9% | 50.0% |
| Interquartile 75% (IQ3) | 89.7% | 79.5% |
| Interquartile Range (IQR) | 6.9% | 29.5% |
| Standard Deviation (Sample) | 7.1% | 20.5% |
| Standard Deviation (Population) | 7.0% | 20.5% |
Similar Demographics by High School Diploma
Demographics Similar to Cherokee by High School Diploma
In terms of high school diploma, the demographic groups most similar to Cherokee are Portuguese (88.5%, a difference of 0.0%), Samoan (88.5%, a difference of 0.010%), Immigrants from Sierra Leone (88.6%, a difference of 0.040%), Inupiat (88.5%, a difference of 0.040%), and Arapaho (88.6%, a difference of 0.050%).
| Demographics | Rating | Rank | High School Diploma |
| Panamanians | 18.0 /100 | #202 | Poor 88.6% |
| Somalis | 17.5 /100 | #203 | Poor 88.6% |
| Armenians | 17.2 /100 | #204 | Poor 88.6% |
| Immigrants | Micronesia | 16.4 /100 | #205 | Poor 88.6% |
| Arapaho | 16.1 /100 | #206 | Poor 88.6% |
| Immigrants | Sierra Leone | 15.8 /100 | #207 | Poor 88.6% |
| Portuguese | 14.4 /100 | #208 | Poor 88.5% |
| Cherokee | 14.3 /100 | #209 | Poor 88.5% |
| Samoans | 14.0 /100 | #210 | Poor 88.5% |
| Inupiat | 13.1 /100 | #211 | Poor 88.5% |
| South American Indians | 12.2 /100 | #212 | Poor 88.5% |
| Immigrants | Somalia | 11.3 /100 | #213 | Poor 88.4% |
| Immigrants | Cameroon | 10.9 /100 | #214 | Poor 88.4% |
| Crow | 10.9 /100 | #215 | Poor 88.4% |
| Chickasaw | 10.7 /100 | #216 | Poor 88.4% |
Demographics Similar to Immigrants from Central America by High School Diploma
In terms of high school diploma, the demographic groups most similar to Immigrants from Central America are Yakama (80.0%, a difference of 0.16%), Spanish American Indian (79.8%, a difference of 0.44%), Immigrants from Mexico (79.5%, a difference of 0.72%), Immigrants from El Salvador (80.8%, a difference of 0.86%), and Immigrants from Guatemala (81.4%, a difference of 1.5%).
| Demographics | Rating | Rank | High School Diploma |
| Immigrants | Latin America | 0.0 /100 | #333 | Tragic 82.1% |
| Tohono O'odham | 0.0 /100 | #334 | Tragic 82.1% |
| Guatemalans | 0.0 /100 | #335 | Tragic 82.0% |
| Immigrants | Dominican Republic | 0.0 /100 | #336 | Tragic 82.0% |
| Immigrants | Yemen | 0.0 /100 | #337 | Tragic 81.8% |
| Salvadorans | 0.0 /100 | #338 | Tragic 81.7% |
| Pima | 0.0 /100 | #339 | Tragic 81.6% |
| Houma | 0.0 /100 | #340 | Tragic 81.5% |
| Mexicans | 0.0 /100 | #341 | Tragic 81.4% |
| Immigrants | Guatemala | 0.0 /100 | #342 | Tragic 81.4% |
| Immigrants | El Salvador | 0.0 /100 | #343 | Tragic 80.8% |
| Immigrants | Central America | 0.0 /100 | #344 | Tragic 80.1% |
| Yakama | 0.0 /100 | #345 | Tragic 80.0% |
| Spanish American Indians | 0.0 /100 | #346 | Tragic 79.8% |
| Immigrants | Mexico | 0.0 /100 | #347 | Tragic 79.5% |