Crow vs Immigrants from Zaire 4th Grade
COMPARE
Crow
Immigrants from Zaire
4th Grade
4th Grade Comparison
Crow
Immigrants from Zaire
99.6%
4TH GRADE
100.0/ 100
METRIC RATING
1st/ 347
METRIC RANK
97.3%
4TH GRADE
12.8/ 100
METRIC RATING
206th/ 347
METRIC RANK
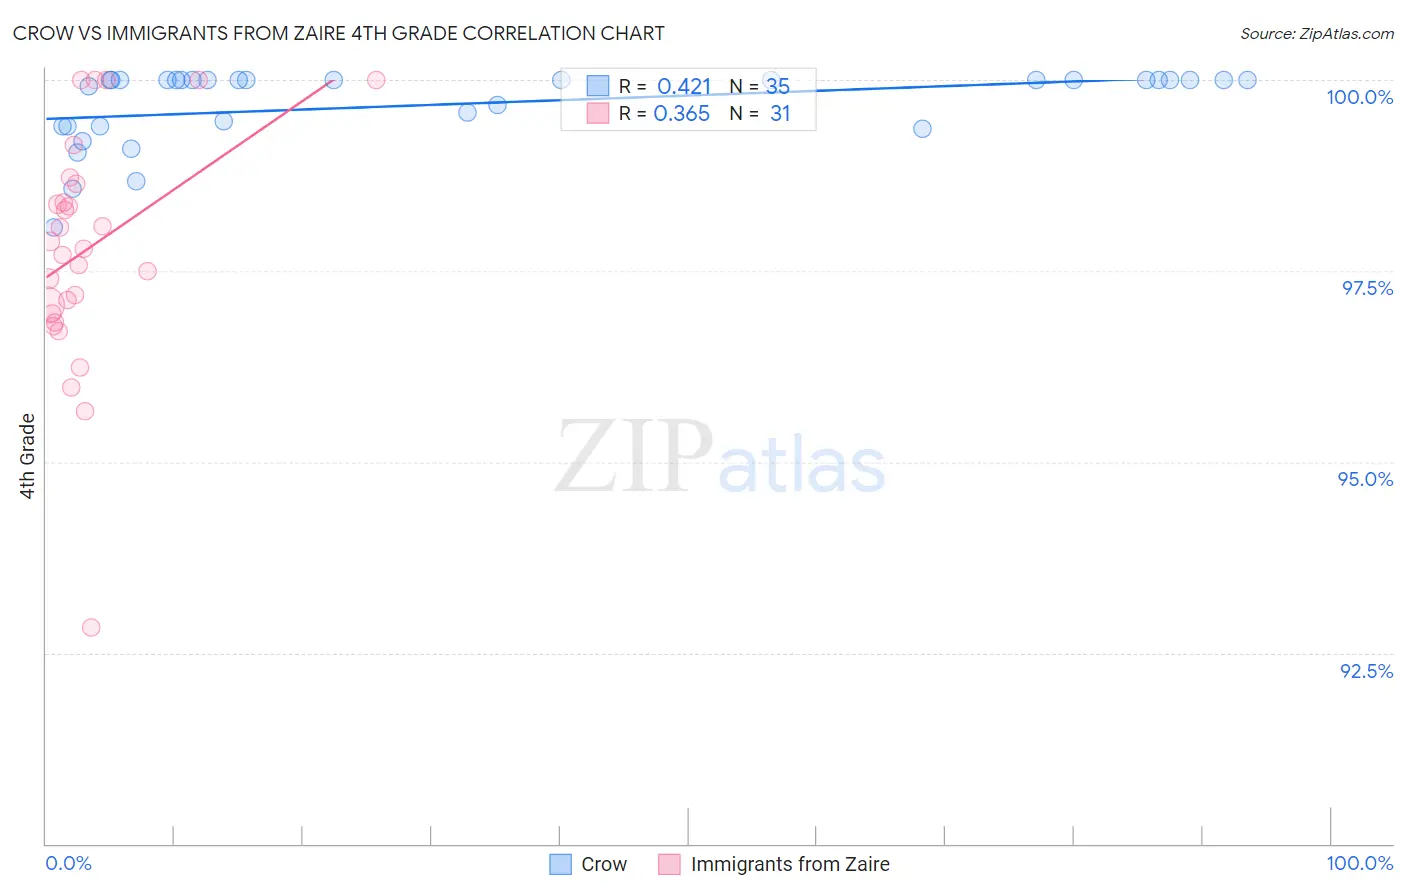
Crow vs Immigrants from Zaire 4th Grade Correlation Chart
The statistical analysis conducted on geographies consisting of 665,246 people shows a moderate positive correlation between the proportion of Crow and percentage of population with at least 4th grade education in the United States with a correlation coefficient (R) of 0.421 and weighted average of 99.6%. Similarly, the statistical analysis conducted on geographies consisting of 107,212,695 people shows a mild positive correlation between the proportion of Immigrants from Zaire and percentage of population with at least 4th grade education in the United States with a correlation coefficient (R) of 0.365 and weighted average of 97.3%, a difference of 2.3%.
4th Grade Correlation Summary
| Measurement | Crow | Immigrants from Zaire |
| Minimum | 98.1% | 92.8% |
| Maximum | 100.0% | 100.0% |
| Range | 1.9% | 7.2% |
| Mean | 99.7% | 97.8% |
| Median | 100.0% | 97.8% |
| Interquartile 25% (IQ1) | 99.4% | 96.9% |
| Interquartile 75% (IQ3) | 100.0% | 98.6% |
| Interquartile Range (IQR) | 0.60% | 1.7% |
| Standard Deviation (Sample) | 0.50% | 1.5% |
| Standard Deviation (Population) | 0.49% | 1.5% |
Similar Demographics by 4th Grade
Demographics Similar to Crow by 4th Grade
In terms of 4th grade, the demographic groups most similar to Crow are Welsh (98.7%, a difference of 0.88%), Tsimshian (98.6%, a difference of 0.94%), Inupiat (98.6%, a difference of 1.0%), Yup'ik (98.5%, a difference of 1.0%), and Norwegian (98.5%, a difference of 1.1%).
| Demographics | Rating | Rank | 4th Grade |
| Crow | 100.0 /100 | #1 | Exceptional 99.6% |
| Welsh | 100.0 /100 | #2 | Exceptional 98.7% |
| Tsimshian | 100.0 /100 | #3 | Exceptional 98.6% |
| Inupiat | 100.0 /100 | #4 | Exceptional 98.6% |
| Yup'ik | 100.0 /100 | #5 | Exceptional 98.5% |
| Norwegians | 100.0 /100 | #6 | Exceptional 98.5% |
| Slovaks | 100.0 /100 | #7 | Exceptional 98.5% |
| Germans | 100.0 /100 | #8 | Exceptional 98.5% |
| Slovenes | 100.0 /100 | #9 | Exceptional 98.4% |
| Alaskan Athabascans | 100.0 /100 | #10 | Exceptional 98.4% |
| English | 100.0 /100 | #11 | Exceptional 98.4% |
| Tlingit-Haida | 100.0 /100 | #12 | Exceptional 98.4% |
| Swedes | 100.0 /100 | #13 | Exceptional 98.4% |
| Carpatho Rusyns | 100.0 /100 | #14 | Exceptional 98.4% |
| Dutch | 100.0 /100 | #15 | Exceptional 98.4% |
Demographics Similar to Immigrants from Zaire by 4th Grade
In terms of 4th grade, the demographic groups most similar to Immigrants from Zaire are Paiute (97.3%, a difference of 0.0%), African (97.4%, a difference of 0.010%), Moroccan (97.3%, a difference of 0.010%), Immigrants from Northern Africa (97.4%, a difference of 0.020%), and Immigrants from Bahamas (97.3%, a difference of 0.020%).
| Demographics | Rating | Rank | 4th Grade |
| Natives/Alaskans | 20.6 /100 | #199 | Fair 97.4% |
| Immigrants | Uganda | 19.8 /100 | #200 | Poor 97.4% |
| Immigrants | Southern Europe | 16.2 /100 | #201 | Poor 97.4% |
| Immigrants | Chile | 16.1 /100 | #202 | Poor 97.4% |
| Immigrants | Northern Africa | 15.1 /100 | #203 | Poor 97.4% |
| Africans | 14.6 /100 | #204 | Poor 97.4% |
| Paiute | 13.2 /100 | #205 | Poor 97.3% |
| Immigrants | Zaire | 12.8 /100 | #206 | Poor 97.3% |
| Moroccans | 11.3 /100 | #207 | Poor 97.3% |
| Immigrants | Bahamas | 10.8 /100 | #208 | Poor 97.3% |
| Laotians | 9.3 /100 | #209 | Tragic 97.3% |
| Immigrants | Oceania | 9.1 /100 | #210 | Tragic 97.3% |
| Sudanese | 9.0 /100 | #211 | Tragic 97.3% |
| Tohono O'odham | 8.4 /100 | #212 | Tragic 97.3% |
| Costa Ricans | 8.3 /100 | #213 | Tragic 97.3% |