Central American vs Immigrants from Kenya 1st Grade
COMPARE
Central American
Immigrants from Kenya
1st Grade
1st Grade Comparison
Central Americans
Immigrants from Kenya
96.5%
1ST GRADE
0.0/ 100
METRIC RATING
332nd/ 347
METRIC RANK
97.8%
1ST GRADE
26.3/ 100
METRIC RATING
196th/ 347
METRIC RANK
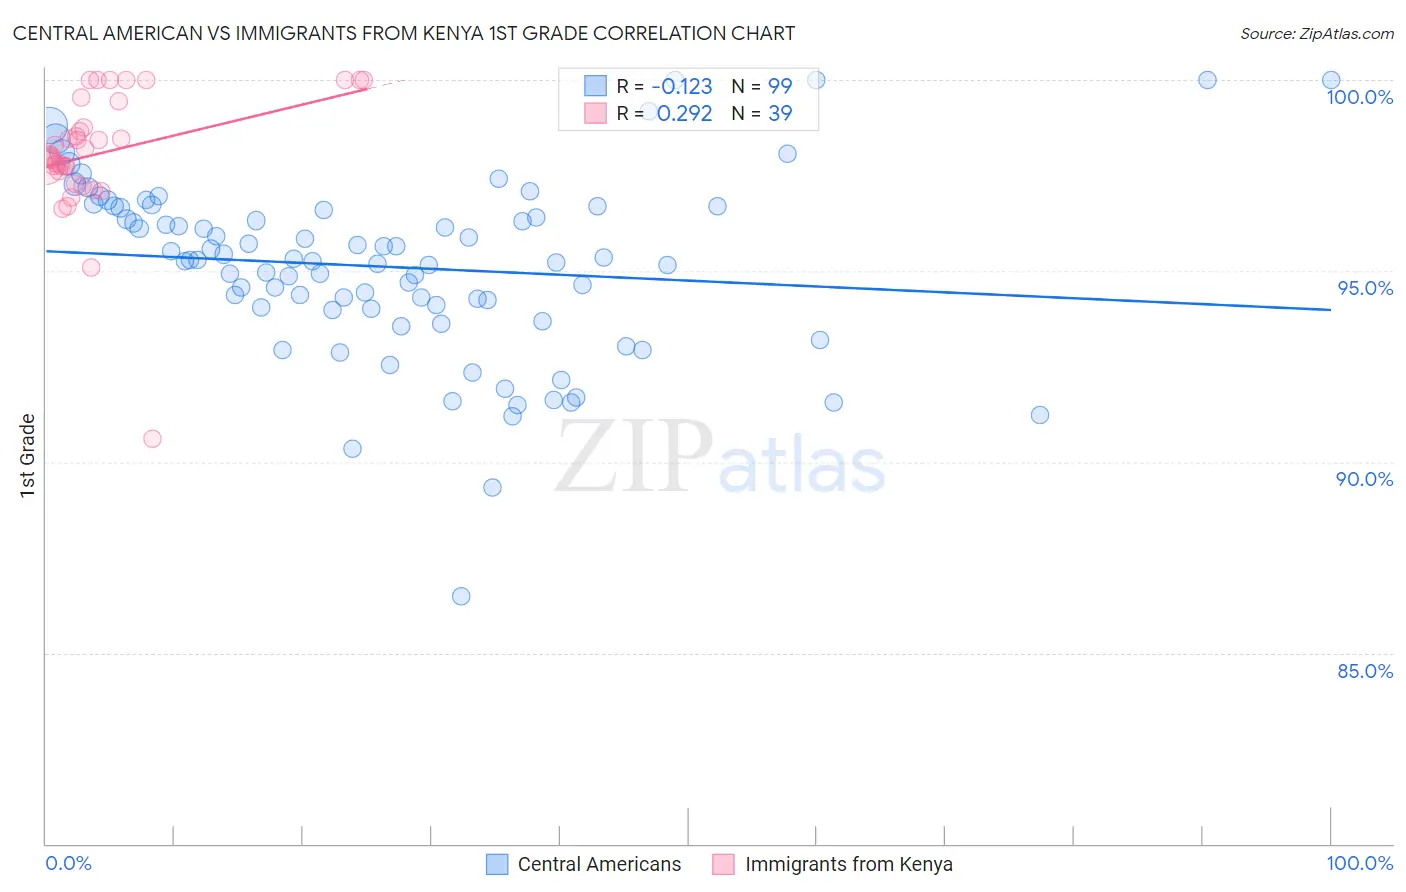
Central American vs Immigrants from Kenya 1st Grade Correlation Chart
The statistical analysis conducted on geographies consisting of 504,619,275 people shows a poor negative correlation between the proportion of Central Americans and percentage of population with at least 1st grade education in the United States with a correlation coefficient (R) of -0.123 and weighted average of 96.5%. Similarly, the statistical analysis conducted on geographies consisting of 218,076,690 people shows a weak positive correlation between the proportion of Immigrants from Kenya and percentage of population with at least 1st grade education in the United States with a correlation coefficient (R) of 0.292 and weighted average of 97.8%, a difference of 1.3%.
1st Grade Correlation Summary
| Measurement | Central American | Immigrants from Kenya |
| Minimum | 86.5% | 90.6% |
| Maximum | 100.0% | 100.0% |
| Range | 13.5% | 9.4% |
| Mean | 95.1% | 98.1% |
| Median | 95.3% | 98.0% |
| Interquartile 25% (IQ1) | 94.0% | 97.6% |
| Interquartile 75% (IQ3) | 96.7% | 99.5% |
| Interquartile Range (IQR) | 2.6% | 1.8% |
| Standard Deviation (Sample) | 2.4% | 1.7% |
| Standard Deviation (Population) | 2.3% | 1.7% |
Similar Demographics by 1st Grade
Demographics Similar to Central Americans by 1st Grade
In terms of 1st grade, the demographic groups most similar to Central Americans are Immigrants from Dominican Republic (96.5%, a difference of 0.010%), Bangladeshi (96.5%, a difference of 0.010%), Yakama (96.5%, a difference of 0.040%), Immigrants from Armenia (96.6%, a difference of 0.050%), and Guatemalan (96.5%, a difference of 0.060%).
| Demographics | Rating | Rank | 1st Grade |
| Dominicans | 0.0 /100 | #325 | Tragic 96.7% |
| Indonesians | 0.0 /100 | #326 | Tragic 96.7% |
| Mexicans | 0.0 /100 | #327 | Tragic 96.7% |
| Immigrants | Latin America | 0.0 /100 | #328 | Tragic 96.7% |
| Japanese | 0.0 /100 | #329 | Tragic 96.6% |
| Immigrants | Vietnam | 0.0 /100 | #330 | Tragic 96.6% |
| Immigrants | Armenia | 0.0 /100 | #331 | Tragic 96.6% |
| Central Americans | 0.0 /100 | #332 | Tragic 96.5% |
| Immigrants | Dominican Republic | 0.0 /100 | #333 | Tragic 96.5% |
| Bangladeshis | 0.0 /100 | #334 | Tragic 96.5% |
| Yakama | 0.0 /100 | #335 | Tragic 96.5% |
| Guatemalans | 0.0 /100 | #336 | Tragic 96.5% |
| Immigrants | Cambodia | 0.0 /100 | #337 | Tragic 96.5% |
| Immigrants | Fiji | 0.0 /100 | #338 | Tragic 96.4% |
| Immigrants | Guatemala | 0.0 /100 | #339 | Tragic 96.4% |
Demographics Similar to Immigrants from Kenya by 1st Grade
In terms of 1st grade, the demographic groups most similar to Immigrants from Kenya are Guamanian/Chamorro (97.8%, a difference of 0.0%), Paraguayan (97.9%, a difference of 0.010%), Immigrants from Taiwan (97.9%, a difference of 0.010%), Mongolian (97.9%, a difference of 0.010%), and Hawaiian (97.9%, a difference of 0.010%).
| Demographics | Rating | Rank | 1st Grade |
| Immigrants | Kazakhstan | 34.9 /100 | #189 | Fair 97.9% |
| Panamanians | 34.1 /100 | #190 | Fair 97.9% |
| Blacks/African Americans | 30.7 /100 | #191 | Fair 97.9% |
| Paraguayans | 30.2 /100 | #192 | Fair 97.9% |
| Immigrants | Taiwan | 29.4 /100 | #193 | Fair 97.9% |
| Mongolians | 29.2 /100 | #194 | Fair 97.9% |
| Hawaiians | 28.8 /100 | #195 | Fair 97.9% |
| Immigrants | Kenya | 26.3 /100 | #196 | Fair 97.8% |
| Guamanians/Chamorros | 26.2 /100 | #197 | Fair 97.8% |
| Yuman | 24.4 /100 | #198 | Fair 97.8% |
| Tohono O'odham | 23.2 /100 | #199 | Fair 97.8% |
| Immigrants | Egypt | 22.6 /100 | #200 | Fair 97.8% |
| Immigrants | Lebanon | 20.1 /100 | #201 | Fair 97.8% |
| Immigrants | Ukraine | 19.2 /100 | #202 | Poor 97.8% |
| Immigrants | Southern Europe | 18.2 /100 | #203 | Poor 97.8% |