Japanese vs Immigrants from Kenya 1st Grade
COMPARE
Japanese
Immigrants from Kenya
1st Grade
1st Grade Comparison
Japanese
Immigrants from Kenya
96.6%
1ST GRADE
0.0/ 100
METRIC RATING
329th/ 347
METRIC RANK
97.8%
1ST GRADE
26.3/ 100
METRIC RATING
196th/ 347
METRIC RANK
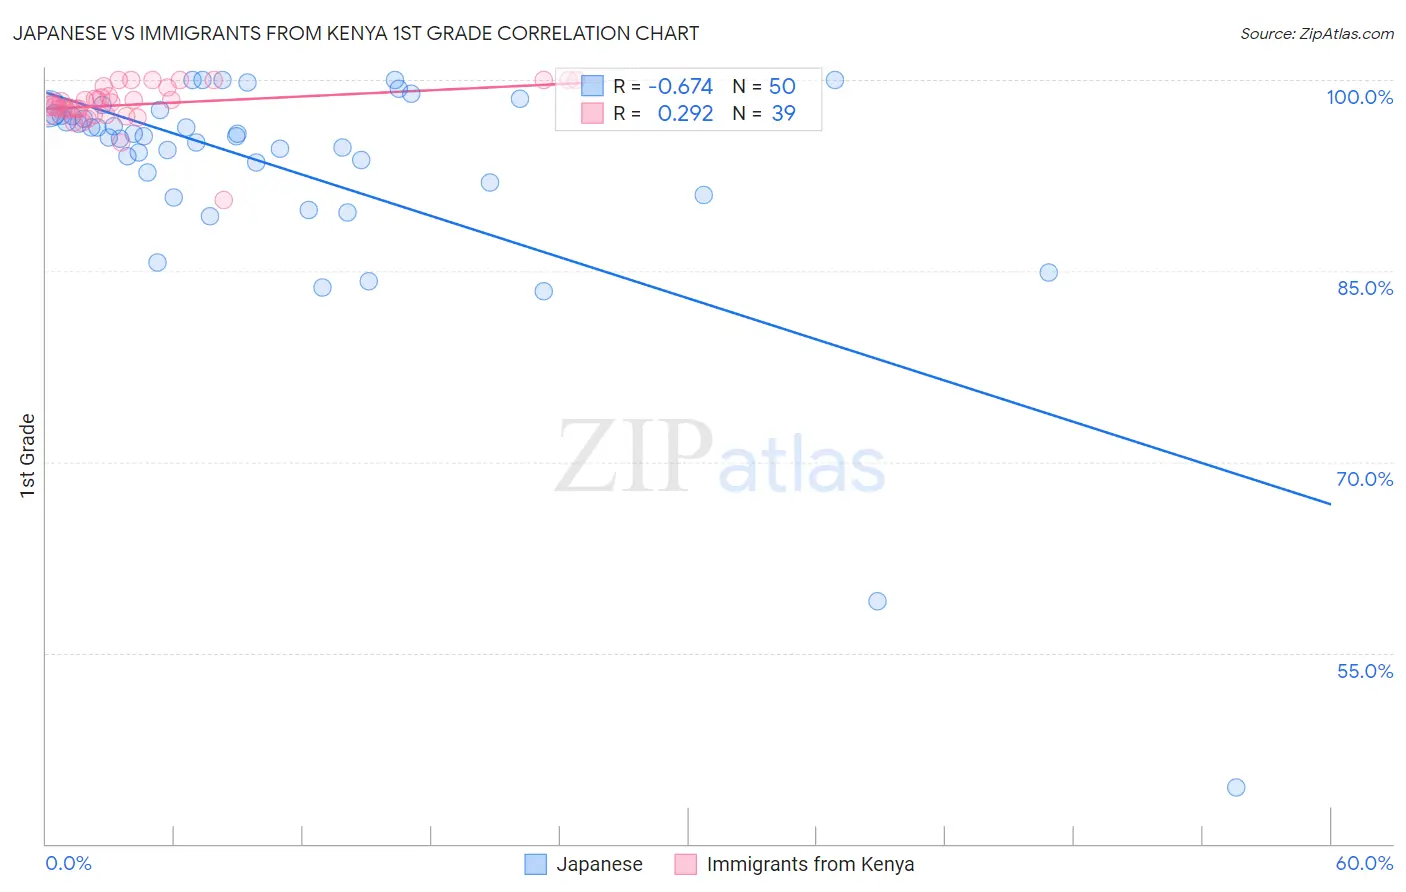
Japanese vs Immigrants from Kenya 1st Grade Correlation Chart
The statistical analysis conducted on geographies consisting of 249,183,224 people shows a significant negative correlation between the proportion of Japanese and percentage of population with at least 1st grade education in the United States with a correlation coefficient (R) of -0.674 and weighted average of 96.6%. Similarly, the statistical analysis conducted on geographies consisting of 218,076,690 people shows a weak positive correlation between the proportion of Immigrants from Kenya and percentage of population with at least 1st grade education in the United States with a correlation coefficient (R) of 0.292 and weighted average of 97.8%, a difference of 1.3%.
1st Grade Correlation Summary
| Measurement | Japanese | Immigrants from Kenya |
| Minimum | 44.4% | 90.6% |
| Maximum | 100.0% | 100.0% |
| Range | 55.6% | 9.4% |
| Mean | 92.9% | 98.1% |
| Median | 95.6% | 98.0% |
| Interquartile 25% (IQ1) | 92.0% | 97.6% |
| Interquartile 75% (IQ3) | 97.3% | 99.5% |
| Interquartile Range (IQR) | 5.3% | 1.8% |
| Standard Deviation (Sample) | 9.7% | 1.7% |
| Standard Deviation (Population) | 9.6% | 1.7% |
Similar Demographics by 1st Grade
Demographics Similar to Japanese by 1st Grade
In terms of 1st grade, the demographic groups most similar to Japanese are Immigrants from Vietnam (96.6%, a difference of 0.010%), Immigrants from Armenia (96.6%, a difference of 0.030%), Immigrants from Latin America (96.7%, a difference of 0.040%), Mexican (96.7%, a difference of 0.050%), and Central American (96.5%, a difference of 0.070%).
| Demographics | Rating | Rank | 1st Grade |
| Mexican American Indians | 0.0 /100 | #322 | Tragic 96.8% |
| Immigrants | Honduras | 0.0 /100 | #323 | Tragic 96.8% |
| Vietnamese | 0.0 /100 | #324 | Tragic 96.8% |
| Dominicans | 0.0 /100 | #325 | Tragic 96.7% |
| Indonesians | 0.0 /100 | #326 | Tragic 96.7% |
| Mexicans | 0.0 /100 | #327 | Tragic 96.7% |
| Immigrants | Latin America | 0.0 /100 | #328 | Tragic 96.7% |
| Japanese | 0.0 /100 | #329 | Tragic 96.6% |
| Immigrants | Vietnam | 0.0 /100 | #330 | Tragic 96.6% |
| Immigrants | Armenia | 0.0 /100 | #331 | Tragic 96.6% |
| Central Americans | 0.0 /100 | #332 | Tragic 96.5% |
| Immigrants | Dominican Republic | 0.0 /100 | #333 | Tragic 96.5% |
| Bangladeshis | 0.0 /100 | #334 | Tragic 96.5% |
| Yakama | 0.0 /100 | #335 | Tragic 96.5% |
| Guatemalans | 0.0 /100 | #336 | Tragic 96.5% |
Demographics Similar to Immigrants from Kenya by 1st Grade
In terms of 1st grade, the demographic groups most similar to Immigrants from Kenya are Guamanian/Chamorro (97.8%, a difference of 0.0%), Paraguayan (97.9%, a difference of 0.010%), Immigrants from Taiwan (97.9%, a difference of 0.010%), Mongolian (97.9%, a difference of 0.010%), and Hawaiian (97.9%, a difference of 0.010%).
| Demographics | Rating | Rank | 1st Grade |
| Immigrants | Kazakhstan | 34.9 /100 | #189 | Fair 97.9% |
| Panamanians | 34.1 /100 | #190 | Fair 97.9% |
| Blacks/African Americans | 30.7 /100 | #191 | Fair 97.9% |
| Paraguayans | 30.2 /100 | #192 | Fair 97.9% |
| Immigrants | Taiwan | 29.4 /100 | #193 | Fair 97.9% |
| Mongolians | 29.2 /100 | #194 | Fair 97.9% |
| Hawaiians | 28.8 /100 | #195 | Fair 97.9% |
| Immigrants | Kenya | 26.3 /100 | #196 | Fair 97.8% |
| Guamanians/Chamorros | 26.2 /100 | #197 | Fair 97.8% |
| Yuman | 24.4 /100 | #198 | Fair 97.8% |
| Tohono O'odham | 23.2 /100 | #199 | Fair 97.8% |
| Immigrants | Egypt | 22.6 /100 | #200 | Fair 97.8% |
| Immigrants | Lebanon | 20.1 /100 | #201 | Fair 97.8% |
| Immigrants | Ukraine | 19.2 /100 | #202 | Poor 97.8% |
| Immigrants | Southern Europe | 18.2 /100 | #203 | Poor 97.8% |