Immigrants from Bosnia and Herzegovina vs Immigrants from Kenya 1st Grade
COMPARE
Immigrants from Bosnia and Herzegovina
Immigrants from Kenya
1st Grade
1st Grade Comparison
Immigrants from Bosnia and Herzegovina
Immigrants from Kenya
97.9%
1ST GRADE
46.6/ 100
METRIC RATING
180th/ 347
METRIC RANK
97.8%
1ST GRADE
26.3/ 100
METRIC RATING
196th/ 347
METRIC RANK
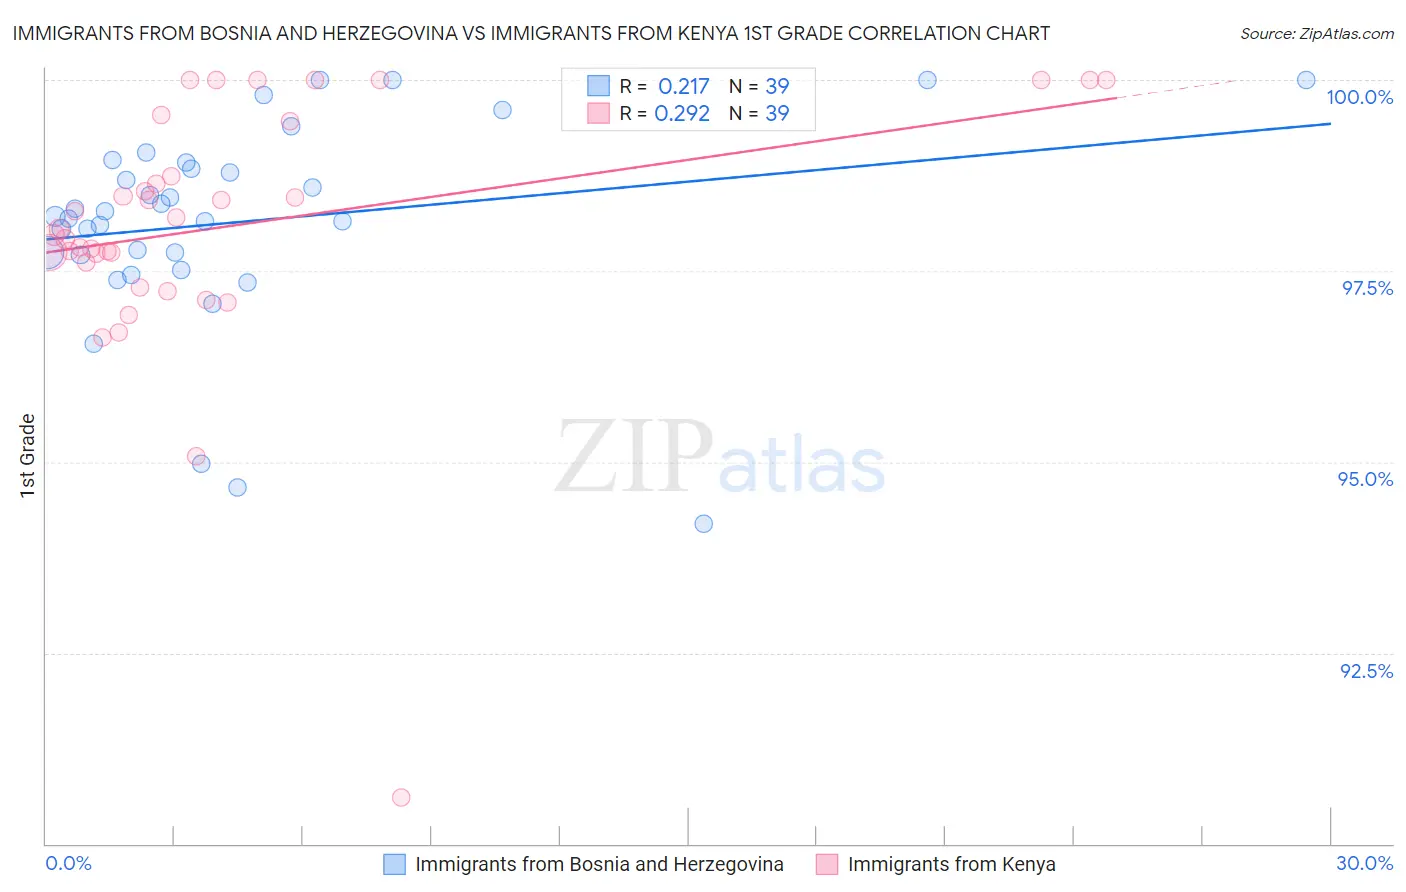
Immigrants from Bosnia and Herzegovina vs Immigrants from Kenya 1st Grade Correlation Chart
The statistical analysis conducted on geographies consisting of 156,779,463 people shows a weak positive correlation between the proportion of Immigrants from Bosnia and Herzegovina and percentage of population with at least 1st grade education in the United States with a correlation coefficient (R) of 0.217 and weighted average of 97.9%. Similarly, the statistical analysis conducted on geographies consisting of 218,076,690 people shows a weak positive correlation between the proportion of Immigrants from Kenya and percentage of population with at least 1st grade education in the United States with a correlation coefficient (R) of 0.292 and weighted average of 97.8%, a difference of 0.070%.
1st Grade Correlation Summary
| Measurement | Immigrants from Bosnia and Herzegovina | Immigrants from Kenya |
| Minimum | 94.2% | 90.6% |
| Maximum | 100.0% | 100.0% |
| Range | 5.8% | 9.4% |
| Mean | 98.1% | 98.1% |
| Median | 98.2% | 98.0% |
| Interquartile 25% (IQ1) | 97.7% | 97.6% |
| Interquartile 75% (IQ3) | 98.9% | 99.5% |
| Interquartile Range (IQR) | 1.2% | 1.8% |
| Standard Deviation (Sample) | 1.3% | 1.7% |
| Standard Deviation (Population) | 1.3% | 1.7% |
Demographics Similar to Immigrants from Bosnia and Herzegovina and Immigrants from Kenya by 1st Grade
In terms of 1st grade, the demographic groups most similar to Immigrants from Bosnia and Herzegovina are Immigrants from Venezuela (97.9%, a difference of 0.0%), Argentinean (97.9%, a difference of 0.0%), Portuguese (97.9%, a difference of 0.010%), Egyptian (97.9%, a difference of 0.010%), and Immigrants from Argentina (97.9%, a difference of 0.020%). Similarly, the demographic groups most similar to Immigrants from Kenya are Guamanian/Chamorro (97.8%, a difference of 0.0%), Paraguayan (97.9%, a difference of 0.010%), Immigrants from Taiwan (97.9%, a difference of 0.010%), Mongolian (97.9%, a difference of 0.010%), and Hawaiian (97.9%, a difference of 0.010%).
| Demographics | Rating | Rank | 1st Grade |
| Immigrants | Venezuela | 47.8 /100 | #178 | Average 97.9% |
| Argentineans | 47.2 /100 | #179 | Average 97.9% |
| Immigrants | Bosnia and Herzegovina | 46.6 /100 | #180 | Average 97.9% |
| Portuguese | 44.2 /100 | #181 | Average 97.9% |
| Egyptians | 42.7 /100 | #182 | Average 97.9% |
| Immigrants | Argentina | 41.3 /100 | #183 | Average 97.9% |
| Immigrants | Poland | 40.1 /100 | #184 | Average 97.9% |
| Immigrants | Belarus | 39.3 /100 | #185 | Fair 97.9% |
| Paiute | 36.5 /100 | #186 | Fair 97.9% |
| Pakistanis | 35.8 /100 | #187 | Fair 97.9% |
| Arabs | 35.5 /100 | #188 | Fair 97.9% |
| Immigrants | Kazakhstan | 34.9 /100 | #189 | Fair 97.9% |
| Panamanians | 34.1 /100 | #190 | Fair 97.9% |
| Blacks/African Americans | 30.7 /100 | #191 | Fair 97.9% |
| Paraguayans | 30.2 /100 | #192 | Fair 97.9% |
| Immigrants | Taiwan | 29.4 /100 | #193 | Fair 97.9% |
| Mongolians | 29.2 /100 | #194 | Fair 97.9% |
| Hawaiians | 28.8 /100 | #195 | Fair 97.9% |
| Immigrants | Kenya | 26.3 /100 | #196 | Fair 97.8% |
| Guamanians/Chamorros | 26.2 /100 | #197 | Fair 97.8% |
| Yuman | 24.4 /100 | #198 | Fair 97.8% |