Albanian vs Tohono O'odham 7th Grade
COMPARE
Albanian
Tohono O'odham
7th Grade
7th Grade Comparison
Albanians
Tohono O'odham
96.3%
7TH GRADE
82.6/ 100
METRIC RATING
149th/ 347
METRIC RANK
95.0%
7TH GRADE
0.1/ 100
METRIC RATING
281st/ 347
METRIC RANK
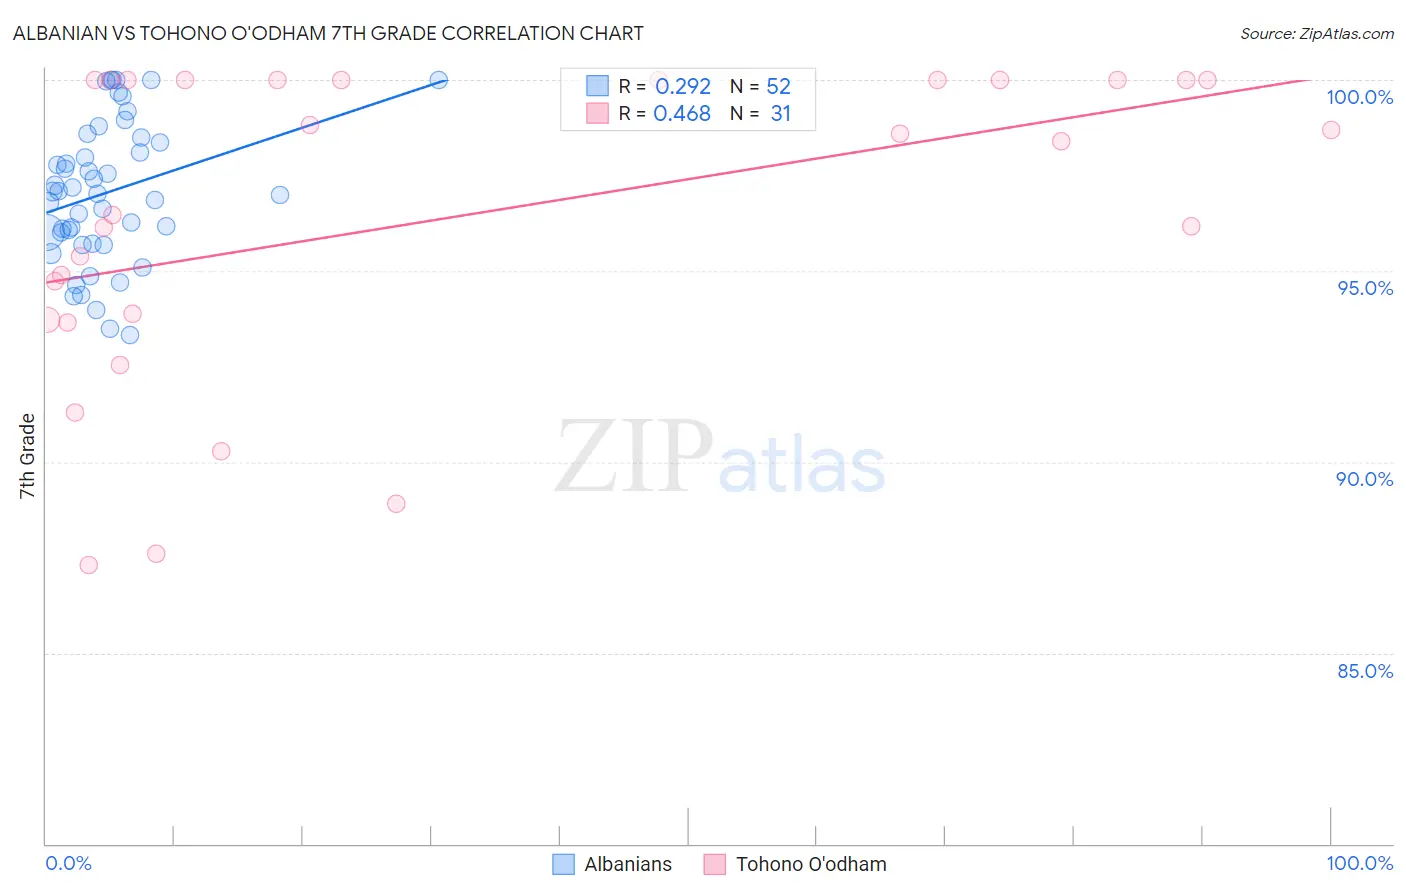
Albanian vs Tohono O'odham 7th Grade Correlation Chart
The statistical analysis conducted on geographies consisting of 193,265,850 people shows a weak positive correlation between the proportion of Albanians and percentage of population with at least 7th grade education in the United States with a correlation coefficient (R) of 0.292 and weighted average of 96.3%. Similarly, the statistical analysis conducted on geographies consisting of 58,730,615 people shows a moderate positive correlation between the proportion of Tohono O'odham and percentage of population with at least 7th grade education in the United States with a correlation coefficient (R) of 0.468 and weighted average of 95.0%, a difference of 1.3%.
7th Grade Correlation Summary
| Measurement | Albanian | Tohono O'odham |
| Minimum | 93.3% | 87.3% |
| Maximum | 100.0% | 100.0% |
| Range | 6.7% | 12.7% |
| Mean | 97.1% | 96.4% |
| Median | 97.0% | 98.4% |
| Interquartile 25% (IQ1) | 95.9% | 93.7% |
| Interquartile 75% (IQ3) | 98.4% | 100.0% |
| Interquartile Range (IQR) | 2.6% | 6.3% |
| Standard Deviation (Sample) | 1.8% | 4.1% |
| Standard Deviation (Population) | 1.8% | 4.0% |
Similar Demographics by 7th Grade
Demographics Similar to Albanians by 7th Grade
In terms of 7th grade, the demographic groups most similar to Albanians are French American Indian (96.3%, a difference of 0.0%), Israeli (96.3%, a difference of 0.0%), Immigrants from Belarus (96.3%, a difference of 0.0%), Blackfeet (96.3%, a difference of 0.010%), and Immigrants from Eastern Europe (96.3%, a difference of 0.010%).
| Demographics | Rating | Rank | 7th Grade |
| Burmese | 87.1 /100 | #142 | Excellent 96.3% |
| Spanish | 86.6 /100 | #143 | Excellent 96.3% |
| Immigrants | Greece | 85.9 /100 | #144 | Excellent 96.3% |
| Blackfeet | 83.9 /100 | #145 | Excellent 96.3% |
| Immigrants | Eastern Europe | 83.7 /100 | #146 | Excellent 96.3% |
| French American Indians | 83.1 /100 | #147 | Excellent 96.3% |
| Israelis | 82.8 /100 | #148 | Excellent 96.3% |
| Albanians | 82.6 /100 | #149 | Excellent 96.3% |
| Immigrants | Belarus | 82.4 /100 | #150 | Excellent 96.3% |
| Hopi | 81.6 /100 | #151 | Excellent 96.3% |
| Immigrants | Russia | 78.4 /100 | #152 | Good 96.2% |
| Seminole | 78.1 /100 | #153 | Good 96.2% |
| Immigrants | Israel | 77.6 /100 | #154 | Good 96.2% |
| Immigrants | Jordan | 77.0 /100 | #155 | Good 96.2% |
| Kenyans | 76.2 /100 | #156 | Good 96.2% |
Demographics Similar to Tohono O'odham by 7th Grade
In terms of 7th grade, the demographic groups most similar to Tohono O'odham are Immigrants from St. Vincent and the Grenadines (95.0%, a difference of 0.0%), Immigrants from Bolivia (95.0%, a difference of 0.010%), Barbadian (95.1%, a difference of 0.030%), Immigrants from Trinidad and Tobago (95.1%, a difference of 0.040%), and Immigrants from Afghanistan (95.1%, a difference of 0.070%).
| Demographics | Rating | Rank | 7th Grade |
| Immigrants | Western Africa | 0.2 /100 | #274 | Tragic 95.1% |
| Immigrants | Colombia | 0.2 /100 | #275 | Tragic 95.1% |
| Immigrants | Thailand | 0.2 /100 | #276 | Tragic 95.1% |
| Immigrants | Afghanistan | 0.2 /100 | #277 | Tragic 95.1% |
| Immigrants | Trinidad and Tobago | 0.1 /100 | #278 | Tragic 95.1% |
| Barbadians | 0.1 /100 | #279 | Tragic 95.1% |
| Immigrants | St. Vincent and the Grenadines | 0.1 /100 | #280 | Tragic 95.0% |
| Tohono O'odham | 0.1 /100 | #281 | Tragic 95.0% |
| Immigrants | Bolivia | 0.1 /100 | #282 | Tragic 95.0% |
| Immigrants | Barbados | 0.1 /100 | #283 | Tragic 95.0% |
| Armenians | 0.1 /100 | #284 | Tragic 95.0% |
| Immigrants | Eritrea | 0.1 /100 | #285 | Tragic 94.9% |
| Immigrants | Philippines | 0.0 /100 | #286 | Tragic 94.9% |
| Immigrants | Peru | 0.0 /100 | #287 | Tragic 94.9% |
| British West Indians | 0.0 /100 | #288 | Tragic 94.8% |