Lebanese vs Soviet Union 11th Grade
COMPARE
Lebanese
Soviet Union
11th Grade
11th Grade Comparison
Lebanese
Soviet Union
93.5%
11TH GRADE
98.6/ 100
METRIC RATING
103rd/ 347
METRIC RANK
93.7%
11TH GRADE
99.5/ 100
METRIC RATING
78th/ 347
METRIC RANK
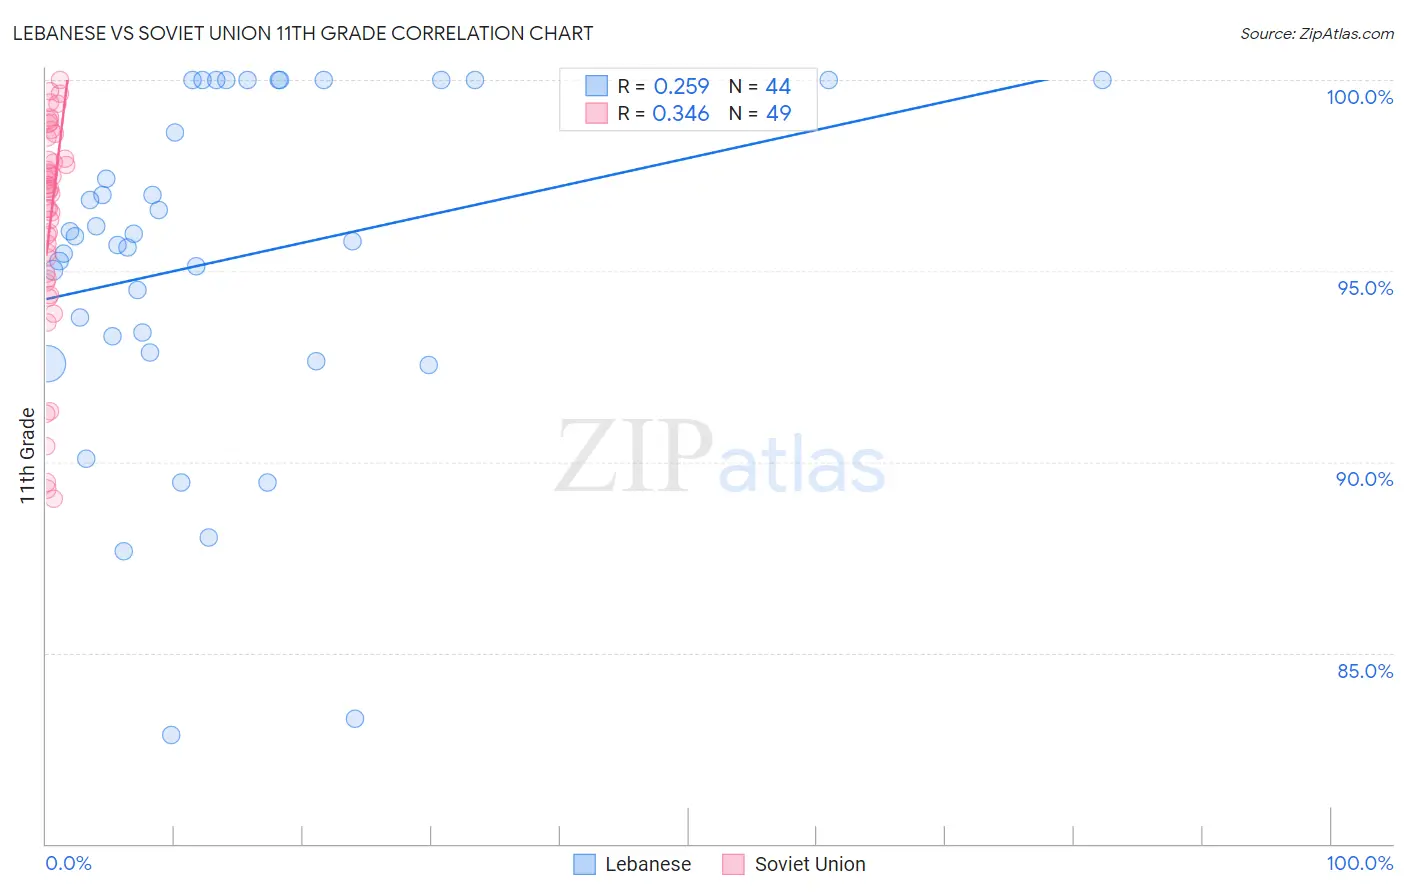
Lebanese vs Soviet Union 11th Grade Correlation Chart
The statistical analysis conducted on geographies consisting of 401,624,157 people shows a weak positive correlation between the proportion of Lebanese and percentage of population with at least 11th grade education in the United States with a correlation coefficient (R) of 0.259 and weighted average of 93.5%. Similarly, the statistical analysis conducted on geographies consisting of 43,454,395 people shows a mild positive correlation between the proportion of Soviet Union and percentage of population with at least 11th grade education in the United States with a correlation coefficient (R) of 0.346 and weighted average of 93.7%, a difference of 0.27%.
11th Grade Correlation Summary
| Measurement | Lebanese | Soviet Union |
| Minimum | 82.8% | 89.0% |
| Maximum | 100.0% | 100.0% |
| Range | 17.2% | 11.0% |
| Mean | 95.3% | 96.3% |
| Median | 95.9% | 97.2% |
| Interquartile 25% (IQ1) | 93.1% | 94.9% |
| Interquartile 75% (IQ3) | 100.0% | 98.2% |
| Interquartile Range (IQR) | 6.9% | 3.4% |
| Standard Deviation (Sample) | 4.4% | 2.8% |
| Standard Deviation (Population) | 4.4% | 2.8% |
Similar Demographics by 11th Grade
Demographics Similar to Lebanese by 11th Grade
In terms of 11th grade, the demographic groups most similar to Lebanese are Chippewa (93.5%, a difference of 0.0%), Immigrants from Europe (93.5%, a difference of 0.0%), Immigrants from Serbia (93.5%, a difference of 0.0%), Immigrants from Croatia (93.5%, a difference of 0.0%), and Immigrants from Romania (93.5%, a difference of 0.010%).
| Demographics | Rating | Rank | 11th Grade |
| Immigrants | Turkey | 98.9 /100 | #96 | Exceptional 93.5% |
| Immigrants | Iran | 98.9 /100 | #97 | Exceptional 93.5% |
| Immigrants | Israel | 98.8 /100 | #98 | Exceptional 93.5% |
| Menominee | 98.7 /100 | #99 | Exceptional 93.5% |
| Immigrants | North Macedonia | 98.7 /100 | #100 | Exceptional 93.5% |
| Immigrants | Romania | 98.7 /100 | #101 | Exceptional 93.5% |
| Chippewa | 98.6 /100 | #102 | Exceptional 93.5% |
| Lebanese | 98.6 /100 | #103 | Exceptional 93.5% |
| Immigrants | Europe | 98.6 /100 | #104 | Exceptional 93.5% |
| Immigrants | Serbia | 98.6 /100 | #105 | Exceptional 93.5% |
| Immigrants | Croatia | 98.6 /100 | #106 | Exceptional 93.5% |
| Immigrants | Norway | 98.4 /100 | #107 | Exceptional 93.5% |
| Alaska Natives | 98.4 /100 | #108 | Exceptional 93.5% |
| Immigrants | Kuwait | 98.4 /100 | #109 | Exceptional 93.5% |
| Syrians | 98.4 /100 | #110 | Exceptional 93.4% |
Demographics Similar to Soviet Union by 11th Grade
In terms of 11th grade, the demographic groups most similar to Soviet Union are Aleut (93.7%, a difference of 0.0%), Celtic (93.7%, a difference of 0.010%), Immigrants from Denmark (93.7%, a difference of 0.010%), Immigrants from Latvia (93.8%, a difference of 0.030%), and Canadian (93.7%, a difference of 0.030%).
| Demographics | Rating | Rank | 11th Grade |
| Immigrants | South Africa | 99.7 /100 | #71 | Exceptional 93.8% |
| Immigrants | Japan | 99.7 /100 | #72 | Exceptional 93.8% |
| Romanians | 99.6 /100 | #73 | Exceptional 93.8% |
| Immigrants | Czechoslovakia | 99.6 /100 | #74 | Exceptional 93.8% |
| Immigrants | Latvia | 99.6 /100 | #75 | Exceptional 93.8% |
| Celtics | 99.5 /100 | #76 | Exceptional 93.7% |
| Aleuts | 99.5 /100 | #77 | Exceptional 93.7% |
| Soviet Union | 99.5 /100 | #78 | Exceptional 93.7% |
| Immigrants | Denmark | 99.5 /100 | #79 | Exceptional 93.7% |
| Canadians | 99.5 /100 | #80 | Exceptional 93.7% |
| Immigrants | Moldova | 99.5 /100 | #81 | Exceptional 93.7% |
| Immigrants | Saudi Arabia | 99.3 /100 | #82 | Exceptional 93.7% |
| Icelanders | 99.3 /100 | #83 | Exceptional 93.6% |
| Immigrants | Taiwan | 99.3 /100 | #84 | Exceptional 93.6% |
| Immigrants | Switzerland | 99.3 /100 | #85 | Exceptional 93.6% |