Immigrants from Central America vs Pennsylvania German 2nd Grade
COMPARE
Immigrants from Central America
Pennsylvania German
2nd Grade
2nd Grade Comparison
Immigrants from Central America
Pennsylvania Germans
96.2%
2ND GRADE
0.0/ 100
METRIC RATING
341st/ 347
METRIC RANK
98.5%
2ND GRADE
100.0/ 100
METRIC RATING
24th/ 347
METRIC RANK
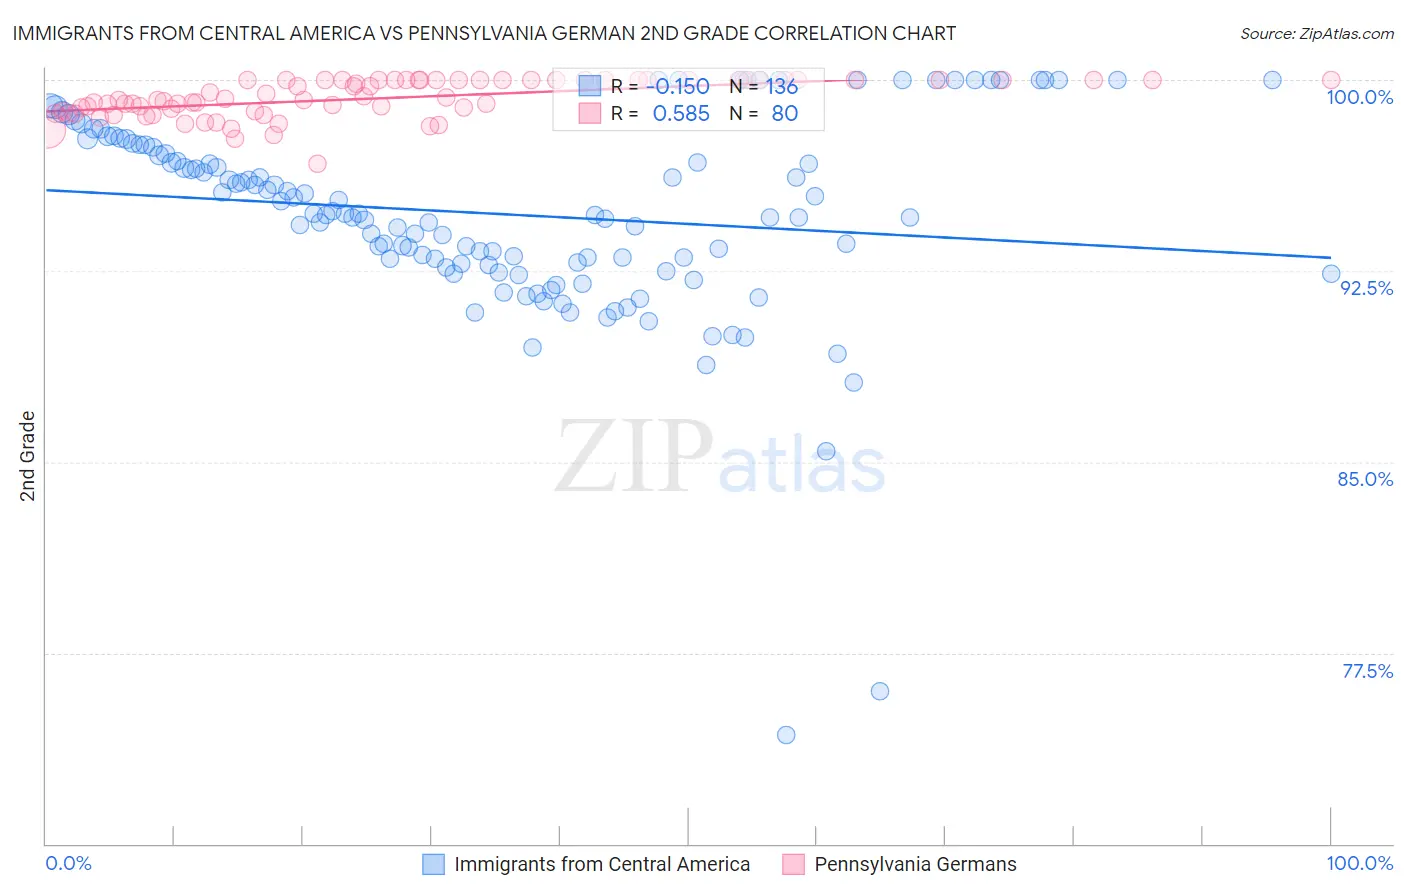
Immigrants from Central America vs Pennsylvania German 2nd Grade Correlation Chart
The statistical analysis conducted on geographies consisting of 536,554,221 people shows a poor negative correlation between the proportion of Immigrants from Central America and percentage of population with at least 2nd grade education in the United States with a correlation coefficient (R) of -0.150 and weighted average of 96.2%. Similarly, the statistical analysis conducted on geographies consisting of 234,102,531 people shows a substantial positive correlation between the proportion of Pennsylvania Germans and percentage of population with at least 2nd grade education in the United States with a correlation coefficient (R) of 0.585 and weighted average of 98.5%, a difference of 2.5%.
2nd Grade Correlation Summary
| Measurement | Immigrants from Central America | Pennsylvania German |
| Minimum | 74.3% | 96.7% |
| Maximum | 100.0% | 100.0% |
| Range | 25.7% | 3.3% |
| Mean | 94.7% | 99.3% |
| Median | 94.7% | 99.2% |
| Interquartile 25% (IQ1) | 92.8% | 98.8% |
| Interquartile 75% (IQ3) | 97.4% | 100.0% |
| Interquartile Range (IQR) | 4.6% | 1.2% |
| Standard Deviation (Sample) | 3.9% | 0.73% |
| Standard Deviation (Population) | 3.9% | 0.73% |
Similar Demographics by 2nd Grade
Demographics Similar to Immigrants from Central America by 2nd Grade
In terms of 2nd grade, the demographic groups most similar to Immigrants from Central America are Immigrants from Guatemala (96.2%, a difference of 0.010%), Immigrants from Mexico (96.1%, a difference of 0.030%), Nepalese (96.1%, a difference of 0.11%), Guatemalan (96.3%, a difference of 0.15%), and Salvadoran (96.0%, a difference of 0.15%).
| Demographics | Rating | Rank | 2nd Grade |
| Immigrants | Dominican Republic | 0.0 /100 | #333 | Tragic 96.4% |
| Central Americans | 0.0 /100 | #334 | Tragic 96.4% |
| Yakama | 0.0 /100 | #335 | Tragic 96.4% |
| Immigrants | Fiji | 0.0 /100 | #336 | Tragic 96.4% |
| Immigrants | Cambodia | 0.0 /100 | #337 | Tragic 96.4% |
| Immigrants | Cabo Verde | 0.0 /100 | #338 | Tragic 96.3% |
| Guatemalans | 0.0 /100 | #339 | Tragic 96.3% |
| Immigrants | Guatemala | 0.0 /100 | #340 | Tragic 96.2% |
| Immigrants | Central America | 0.0 /100 | #341 | Tragic 96.2% |
| Immigrants | Mexico | 0.0 /100 | #342 | Tragic 96.1% |
| Nepalese | 0.0 /100 | #343 | Tragic 96.1% |
| Salvadorans | 0.0 /100 | #344 | Tragic 96.0% |
| Immigrants | El Salvador | 0.0 /100 | #345 | Tragic 95.9% |
| Immigrants | Yemen | 0.0 /100 | #346 | Tragic 95.7% |
| Spanish American Indians | 0.0 /100 | #347 | Tragic 95.6% |
Demographics Similar to Pennsylvania Germans by 2nd Grade
In terms of 2nd grade, the demographic groups most similar to Pennsylvania Germans are Finnish (98.5%, a difference of 0.0%), Sioux (98.5%, a difference of 0.0%), Lithuanian (98.5%, a difference of 0.0%), Polish (98.5%, a difference of 0.0%), and Danish (98.5%, a difference of 0.0%).
| Demographics | Rating | Rank | 2nd Grade |
| Aleuts | 100.0 /100 | #17 | Exceptional 98.6% |
| Irish | 100.0 /100 | #18 | Exceptional 98.6% |
| Finns | 100.0 /100 | #19 | Exceptional 98.5% |
| Sioux | 100.0 /100 | #20 | Exceptional 98.5% |
| Lithuanians | 100.0 /100 | #21 | Exceptional 98.5% |
| Poles | 100.0 /100 | #22 | Exceptional 98.5% |
| Danes | 100.0 /100 | #23 | Exceptional 98.5% |
| Pennsylvania Germans | 100.0 /100 | #24 | Exceptional 98.5% |
| Scotch-Irish | 100.0 /100 | #25 | Exceptional 98.5% |
| Welsh | 100.0 /100 | #26 | Exceptional 98.5% |
| Croatians | 100.0 /100 | #27 | Exceptional 98.5% |
| Arapaho | 100.0 /100 | #28 | Exceptional 98.5% |
| French | 100.0 /100 | #29 | Exceptional 98.5% |
| Europeans | 100.0 /100 | #30 | Exceptional 98.5% |
| Czechs | 100.0 /100 | #31 | Exceptional 98.5% |