Central American Indian vs Japanese 2nd Grade
COMPARE
Central American Indian
Japanese
2nd Grade
2nd Grade Comparison
Central American Indians
Japanese
97.0%
2ND GRADE
0.0/ 100
METRIC RATING
301st/ 347
METRIC RANK
96.5%
2ND GRADE
0.0/ 100
METRIC RATING
329th/ 347
METRIC RANK
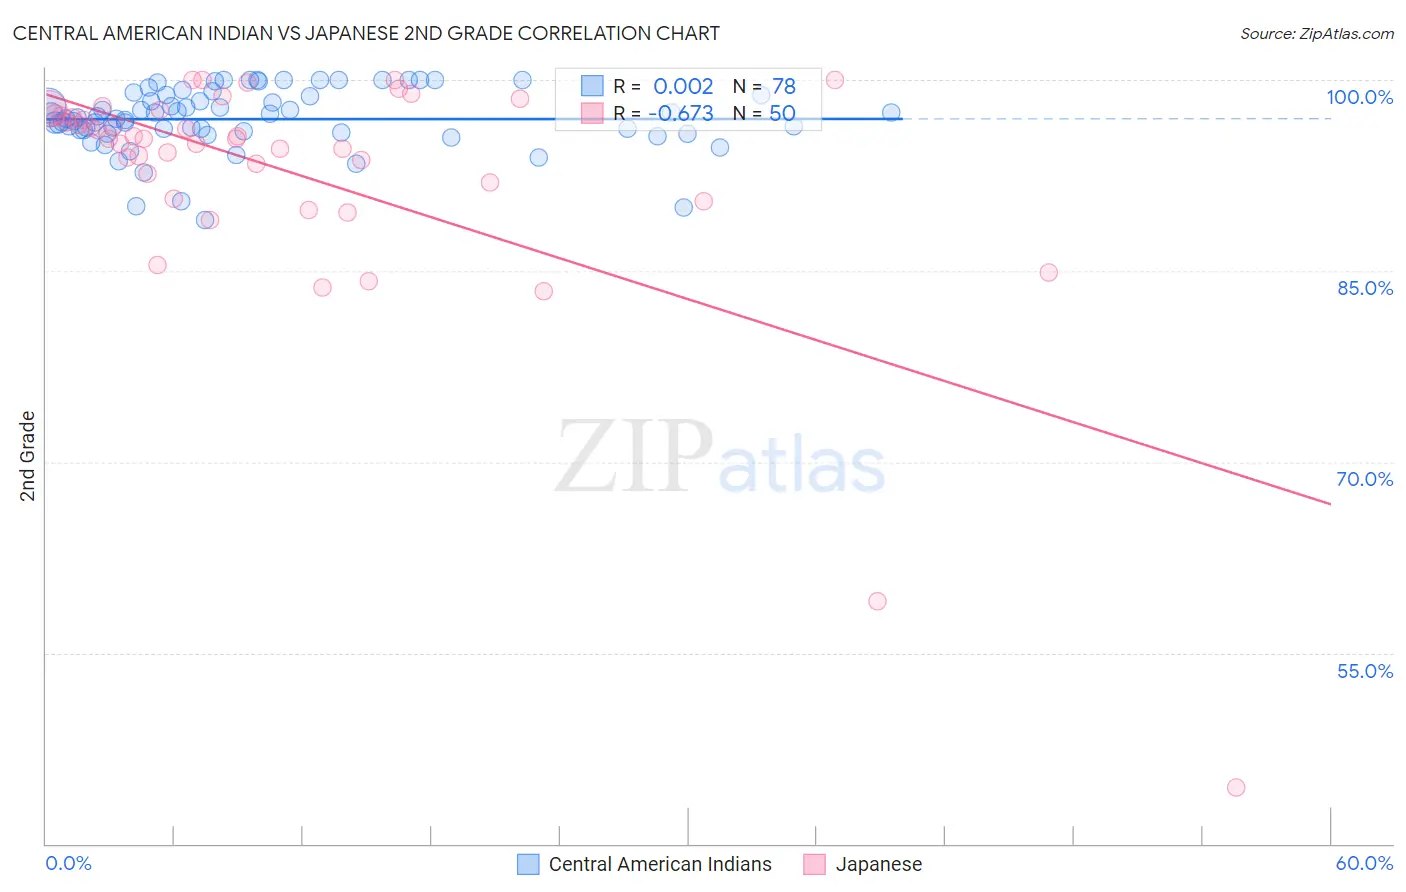
Central American Indian vs Japanese 2nd Grade Correlation Chart
The statistical analysis conducted on geographies consisting of 326,141,205 people shows no correlation between the proportion of Central American Indians and percentage of population with at least 2nd grade education in the United States with a correlation coefficient (R) of 0.002 and weighted average of 97.0%. Similarly, the statistical analysis conducted on geographies consisting of 249,183,224 people shows a significant negative correlation between the proportion of Japanese and percentage of population with at least 2nd grade education in the United States with a correlation coefficient (R) of -0.673 and weighted average of 96.5%, a difference of 0.47%.
2nd Grade Correlation Summary
| Measurement | Central American Indian | Japanese |
| Minimum | 89.0% | 44.4% |
| Maximum | 100.0% | 100.0% |
| Range | 11.0% | 55.6% |
| Mean | 96.9% | 92.8% |
| Median | 97.0% | 95.4% |
| Interquartile 25% (IQ1) | 96.0% | 92.0% |
| Interquartile 75% (IQ3) | 98.8% | 97.2% |
| Interquartile Range (IQR) | 2.8% | 5.2% |
| Standard Deviation (Sample) | 2.5% | 9.7% |
| Standard Deviation (Population) | 2.4% | 9.6% |
Similar Demographics by 2nd Grade
Demographics Similar to Central American Indians by 2nd Grade
In terms of 2nd grade, the demographic groups most similar to Central American Indians are Immigrants from South Eastern Asia (97.0%, a difference of 0.020%), Somali (97.0%, a difference of 0.020%), Immigrants from Cuba (97.0%, a difference of 0.040%), Immigrants from Dominica (97.0%, a difference of 0.040%), and Haitian (97.0%, a difference of 0.040%).
| Demographics | Rating | Rank | 2nd Grade |
| Malaysians | 0.0 /100 | #294 | Tragic 97.1% |
| Immigrants | Grenada | 0.0 /100 | #295 | Tragic 97.1% |
| Immigrants | Immigrants | 0.0 /100 | #296 | Tragic 97.1% |
| Immigrants | Cuba | 0.0 /100 | #297 | Tragic 97.0% |
| Immigrants | Dominica | 0.0 /100 | #298 | Tragic 97.0% |
| Haitians | 0.0 /100 | #299 | Tragic 97.0% |
| Immigrants | South Eastern Asia | 0.0 /100 | #300 | Tragic 97.0% |
| Central American Indians | 0.0 /100 | #301 | Tragic 97.0% |
| Somalis | 0.0 /100 | #302 | Tragic 97.0% |
| Ecuadorians | 0.0 /100 | #303 | Tragic 96.9% |
| Immigrants | Caribbean | 0.0 /100 | #304 | Tragic 96.9% |
| Nicaraguans | 0.0 /100 | #305 | Tragic 96.9% |
| Immigrants | Somalia | 0.0 /100 | #306 | Tragic 96.9% |
| Immigrants | Azores | 0.0 /100 | #307 | Tragic 96.8% |
| Immigrants | Haiti | 0.0 /100 | #308 | Tragic 96.8% |
Demographics Similar to Japanese by 2nd Grade
In terms of 2nd grade, the demographic groups most similar to Japanese are Mexican (96.5%, a difference of 0.0%), Immigrants from Vietnam (96.5%, a difference of 0.010%), Immigrants from Latin America (96.5%, a difference of 0.010%), Immigrants from Armenia (96.5%, a difference of 0.040%), and Bangladeshi (96.5%, a difference of 0.060%).
| Demographics | Rating | Rank | 2nd Grade |
| Immigrants | Bangladesh | 0.0 /100 | #322 | Tragic 96.7% |
| Vietnamese | 0.0 /100 | #323 | Tragic 96.7% |
| Mexican American Indians | 0.0 /100 | #324 | Tragic 96.7% |
| Dominicans | 0.0 /100 | #325 | Tragic 96.6% |
| Immigrants | Honduras | 0.0 /100 | #326 | Tragic 96.6% |
| Immigrants | Vietnam | 0.0 /100 | #327 | Tragic 96.5% |
| Mexicans | 0.0 /100 | #328 | Tragic 96.5% |
| Japanese | 0.0 /100 | #329 | Tragic 96.5% |
| Immigrants | Latin America | 0.0 /100 | #330 | Tragic 96.5% |
| Immigrants | Armenia | 0.0 /100 | #331 | Tragic 96.5% |
| Bangladeshis | 0.0 /100 | #332 | Tragic 96.5% |
| Immigrants | Dominican Republic | 0.0 /100 | #333 | Tragic 96.4% |
| Central Americans | 0.0 /100 | #334 | Tragic 96.4% |
| Yakama | 0.0 /100 | #335 | Tragic 96.4% |
| Immigrants | Fiji | 0.0 /100 | #336 | Tragic 96.4% |