Immigrants from Uzbekistan vs Pennsylvania German 2nd Grade
COMPARE
Immigrants from Uzbekistan
Pennsylvania German
2nd Grade
2nd Grade Comparison
Immigrants from Uzbekistan
Pennsylvania Germans
97.3%
2ND GRADE
0.1/ 100
METRIC RATING
278th/ 347
METRIC RANK
98.5%
2ND GRADE
100.0/ 100
METRIC RATING
24th/ 347
METRIC RANK
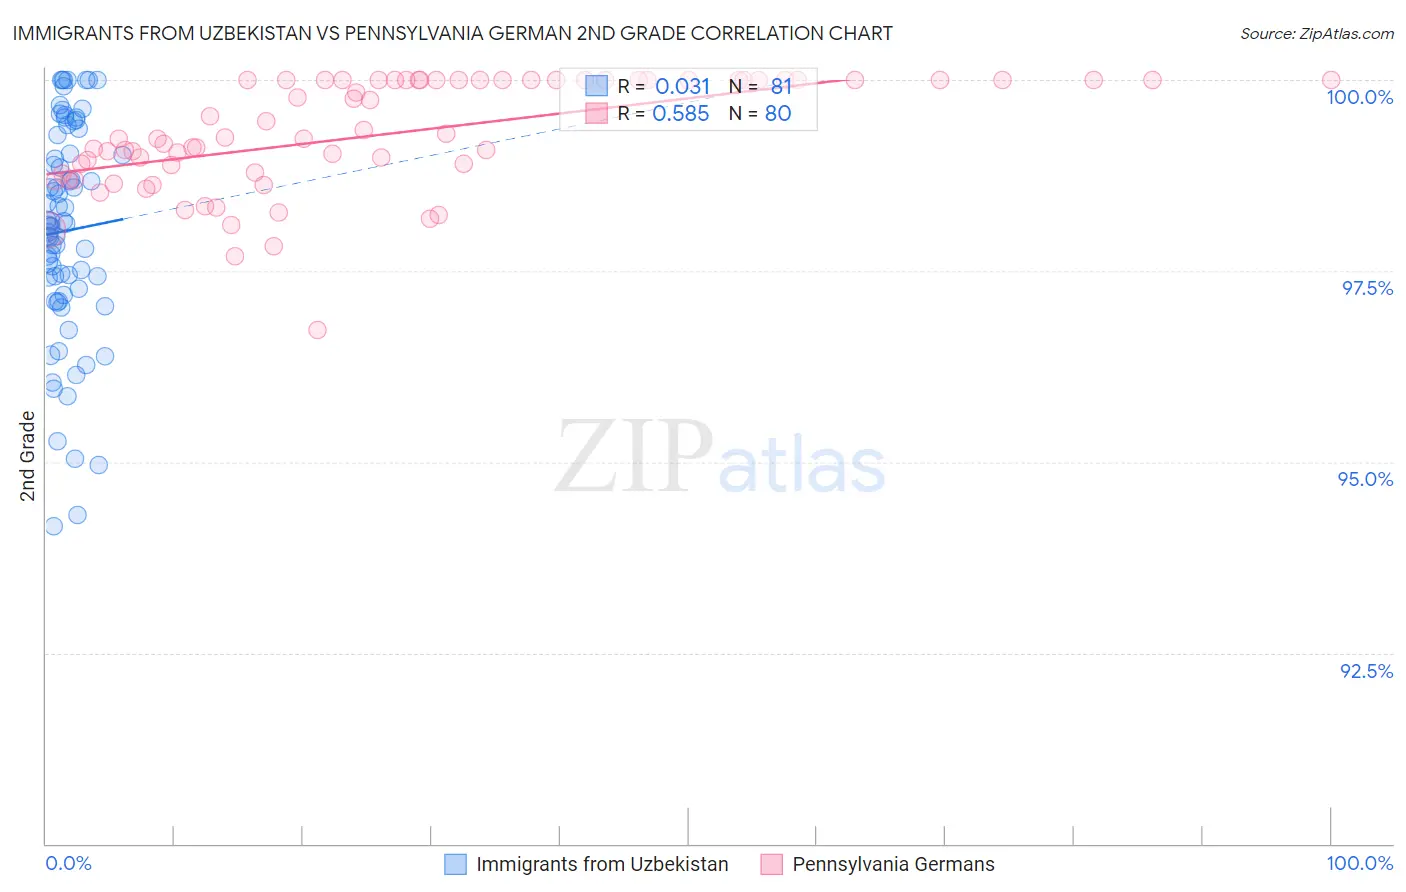
Immigrants from Uzbekistan vs Pennsylvania German 2nd Grade Correlation Chart
The statistical analysis conducted on geographies consisting of 118,593,934 people shows no correlation between the proportion of Immigrants from Uzbekistan and percentage of population with at least 2nd grade education in the United States with a correlation coefficient (R) of 0.031 and weighted average of 97.3%. Similarly, the statistical analysis conducted on geographies consisting of 234,102,531 people shows a substantial positive correlation between the proportion of Pennsylvania Germans and percentage of population with at least 2nd grade education in the United States with a correlation coefficient (R) of 0.585 and weighted average of 98.5%, a difference of 1.3%.
2nd Grade Correlation Summary
| Measurement | Immigrants from Uzbekistan | Pennsylvania German |
| Minimum | 94.2% | 96.7% |
| Maximum | 100.0% | 100.0% |
| Range | 5.8% | 3.3% |
| Mean | 98.0% | 99.3% |
| Median | 98.1% | 99.2% |
| Interquartile 25% (IQ1) | 97.2% | 98.8% |
| Interquartile 75% (IQ3) | 99.2% | 100.0% |
| Interquartile Range (IQR) | 1.9% | 1.2% |
| Standard Deviation (Sample) | 1.4% | 0.73% |
| Standard Deviation (Population) | 1.4% | 0.73% |
Similar Demographics by 2nd Grade
Demographics Similar to Immigrants from Uzbekistan by 2nd Grade
In terms of 2nd grade, the demographic groups most similar to Immigrants from Uzbekistan are Immigrants from Philippines (97.3%, a difference of 0.010%), Immigrants from Western Africa (97.3%, a difference of 0.010%), Immigrants from Ghana (97.3%, a difference of 0.010%), Afghan (97.3%, a difference of 0.020%), and Trinidadian and Tobagonian (97.3%, a difference of 0.020%).
| Demographics | Rating | Rank | 2nd Grade |
| Immigrants | Cameroon | 0.2 /100 | #271 | Tragic 97.4% |
| Immigrants | Peru | 0.1 /100 | #272 | Tragic 97.4% |
| Immigrants | Bolivia | 0.1 /100 | #273 | Tragic 97.4% |
| Ghanaians | 0.1 /100 | #274 | Tragic 97.4% |
| Immigrants | China | 0.1 /100 | #275 | Tragic 97.3% |
| Immigrants | Philippines | 0.1 /100 | #276 | Tragic 97.3% |
| Immigrants | Western Africa | 0.1 /100 | #277 | Tragic 97.3% |
| Immigrants | Uzbekistan | 0.1 /100 | #278 | Tragic 97.3% |
| Immigrants | Ghana | 0.1 /100 | #279 | Tragic 97.3% |
| Afghans | 0.1 /100 | #280 | Tragic 97.3% |
| Trinidadians and Tobagonians | 0.1 /100 | #281 | Tragic 97.3% |
| Barbadians | 0.1 /100 | #282 | Tragic 97.3% |
| Immigrants | Trinidad and Tobago | 0.0 /100 | #283 | Tragic 97.2% |
| Immigrants | West Indies | 0.0 /100 | #284 | Tragic 97.2% |
| Immigrants | Hong Kong | 0.0 /100 | #285 | Tragic 97.2% |
Demographics Similar to Pennsylvania Germans by 2nd Grade
In terms of 2nd grade, the demographic groups most similar to Pennsylvania Germans are Finnish (98.5%, a difference of 0.0%), Sioux (98.5%, a difference of 0.0%), Lithuanian (98.5%, a difference of 0.0%), Polish (98.5%, a difference of 0.0%), and Danish (98.5%, a difference of 0.0%).
| Demographics | Rating | Rank | 2nd Grade |
| Aleuts | 100.0 /100 | #17 | Exceptional 98.6% |
| Irish | 100.0 /100 | #18 | Exceptional 98.6% |
| Finns | 100.0 /100 | #19 | Exceptional 98.5% |
| Sioux | 100.0 /100 | #20 | Exceptional 98.5% |
| Lithuanians | 100.0 /100 | #21 | Exceptional 98.5% |
| Poles | 100.0 /100 | #22 | Exceptional 98.5% |
| Danes | 100.0 /100 | #23 | Exceptional 98.5% |
| Pennsylvania Germans | 100.0 /100 | #24 | Exceptional 98.5% |
| Scotch-Irish | 100.0 /100 | #25 | Exceptional 98.5% |
| Welsh | 100.0 /100 | #26 | Exceptional 98.5% |
| Croatians | 100.0 /100 | #27 | Exceptional 98.5% |
| Arapaho | 100.0 /100 | #28 | Exceptional 98.5% |
| French | 100.0 /100 | #29 | Exceptional 98.5% |
| Europeans | 100.0 /100 | #30 | Exceptional 98.5% |
| Czechs | 100.0 /100 | #31 | Exceptional 98.5% |