Central American Indian vs Immigrants from Korea 4th Grade
COMPARE
Central American Indian
Immigrants from Korea
4th Grade
4th Grade Comparison
Central American Indians
Immigrants from Korea
96.2%
4TH GRADE
0.0/ 100
METRIC RATING
317th/ 347
METRIC RANK
97.5%
4TH GRADE
50.6/ 100
METRIC RATING
173rd/ 347
METRIC RANK
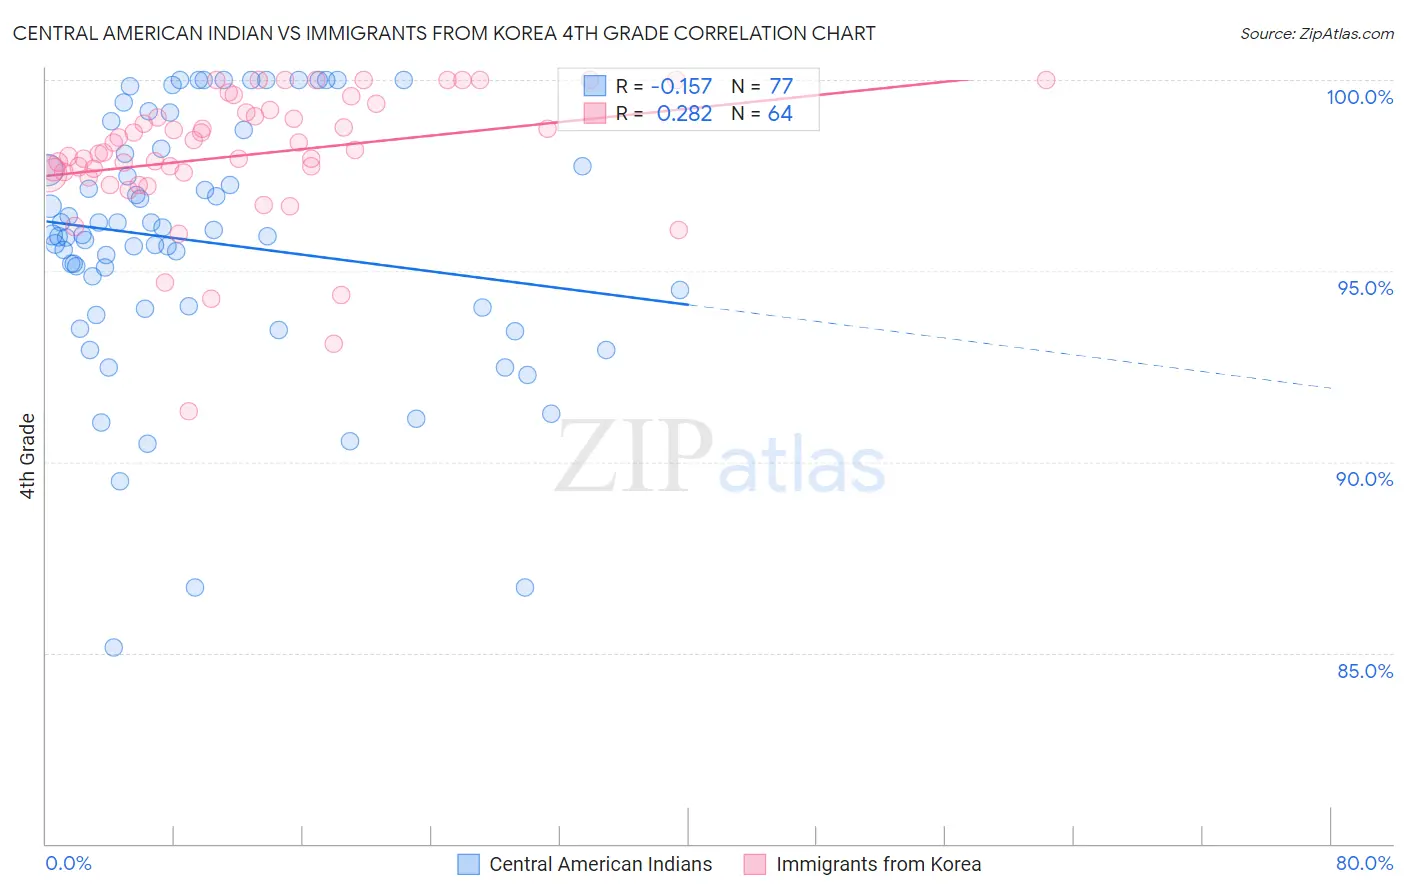
Central American Indian vs Immigrants from Korea 4th Grade Correlation Chart
The statistical analysis conducted on geographies consisting of 326,140,921 people shows a poor negative correlation between the proportion of Central American Indians and percentage of population with at least 4th grade education in the United States with a correlation coefficient (R) of -0.157 and weighted average of 96.2%. Similarly, the statistical analysis conducted on geographies consisting of 416,280,076 people shows a weak positive correlation between the proportion of Immigrants from Korea and percentage of population with at least 4th grade education in the United States with a correlation coefficient (R) of 0.282 and weighted average of 97.5%, a difference of 1.4%.
4th Grade Correlation Summary
| Measurement | Central American Indian | Immigrants from Korea |
| Minimum | 85.1% | 91.3% |
| Maximum | 100.0% | 100.0% |
| Range | 14.9% | 8.7% |
| Mean | 95.8% | 98.0% |
| Median | 95.9% | 98.1% |
| Interquartile 25% (IQ1) | 94.0% | 97.6% |
| Interquartile 75% (IQ3) | 98.1% | 99.2% |
| Interquartile Range (IQR) | 4.1% | 1.6% |
| Standard Deviation (Sample) | 3.3% | 1.7% |
| Standard Deviation (Population) | 3.3% | 1.7% |
Similar Demographics by 4th Grade
Demographics Similar to Central American Indians by 4th Grade
In terms of 4th grade, the demographic groups most similar to Central American Indians are Immigrants from Ecuador (96.2%, a difference of 0.040%), Immigrants from the Azores (96.1%, a difference of 0.040%), Vietnamese (96.2%, a difference of 0.050%), Nicaraguan (96.2%, a difference of 0.050%), and Indonesian (96.2%, a difference of 0.060%).
| Demographics | Rating | Rank | 4th Grade |
| Immigrants | Burma/Myanmar | 0.0 /100 | #310 | Tragic 96.3% |
| Immigrants | Bangladesh | 0.0 /100 | #311 | Tragic 96.2% |
| Cape Verdeans | 0.0 /100 | #312 | Tragic 96.2% |
| Indonesians | 0.0 /100 | #313 | Tragic 96.2% |
| Vietnamese | 0.0 /100 | #314 | Tragic 96.2% |
| Nicaraguans | 0.0 /100 | #315 | Tragic 96.2% |
| Immigrants | Ecuador | 0.0 /100 | #316 | Tragic 96.2% |
| Central American Indians | 0.0 /100 | #317 | Tragic 96.2% |
| Immigrants | Azores | 0.0 /100 | #318 | Tragic 96.1% |
| Belizeans | 0.0 /100 | #319 | Tragic 96.1% |
| Bangladeshis | 0.0 /100 | #320 | Tragic 96.1% |
| Japanese | 0.0 /100 | #321 | Tragic 96.0% |
| Immigrants | Vietnam | 0.0 /100 | #322 | Tragic 96.0% |
| Immigrants | Nicaragua | 0.0 /100 | #323 | Tragic 96.0% |
| Immigrants | Belize | 0.0 /100 | #324 | Tragic 96.0% |
Demographics Similar to Immigrants from Korea by 4th Grade
In terms of 4th grade, the demographic groups most similar to Immigrants from Korea are Immigrants from Spain (97.5%, a difference of 0.0%), Brazilian (97.5%, a difference of 0.0%), Immigrants from Sri Lanka (97.5%, a difference of 0.0%), Egyptian (97.5%, a difference of 0.0%), and Immigrants from Micronesia (97.5%, a difference of 0.0%).
| Demographics | Rating | Rank | 4th Grade |
| Kenyans | 56.5 /100 | #166 | Average 97.5% |
| Immigrants | Poland | 55.9 /100 | #167 | Average 97.5% |
| Immigrants | Belarus | 55.8 /100 | #168 | Average 97.5% |
| Chileans | 54.4 /100 | #169 | Average 97.5% |
| Immigrants | Spain | 51.8 /100 | #170 | Average 97.5% |
| Brazilians | 51.5 /100 | #171 | Average 97.5% |
| Immigrants | Sri Lanka | 51.1 /100 | #172 | Average 97.5% |
| Immigrants | Korea | 50.6 /100 | #173 | Average 97.5% |
| Egyptians | 50.0 /100 | #174 | Average 97.5% |
| Immigrants | Micronesia | 49.6 /100 | #175 | Average 97.5% |
| Arabs | 48.7 /100 | #176 | Average 97.5% |
| Immigrants | Brazil | 46.1 /100 | #177 | Average 97.5% |
| Comanche | 45.3 /100 | #178 | Average 97.5% |
| Immigrants | Kazakhstan | 43.6 /100 | #179 | Average 97.5% |
| Immigrants | Venezuela | 42.7 /100 | #180 | Average 97.5% |