Central American Indian vs Immigrants from Morocco 4th Grade
COMPARE
Central American Indian
Immigrants from Morocco
4th Grade
4th Grade Comparison
Central American Indians
Immigrants from Morocco
96.2%
4TH GRADE
0.0/ 100
METRIC RATING
317th/ 347
METRIC RANK
97.3%
4TH GRADE
7.1/ 100
METRIC RATING
215th/ 347
METRIC RANK
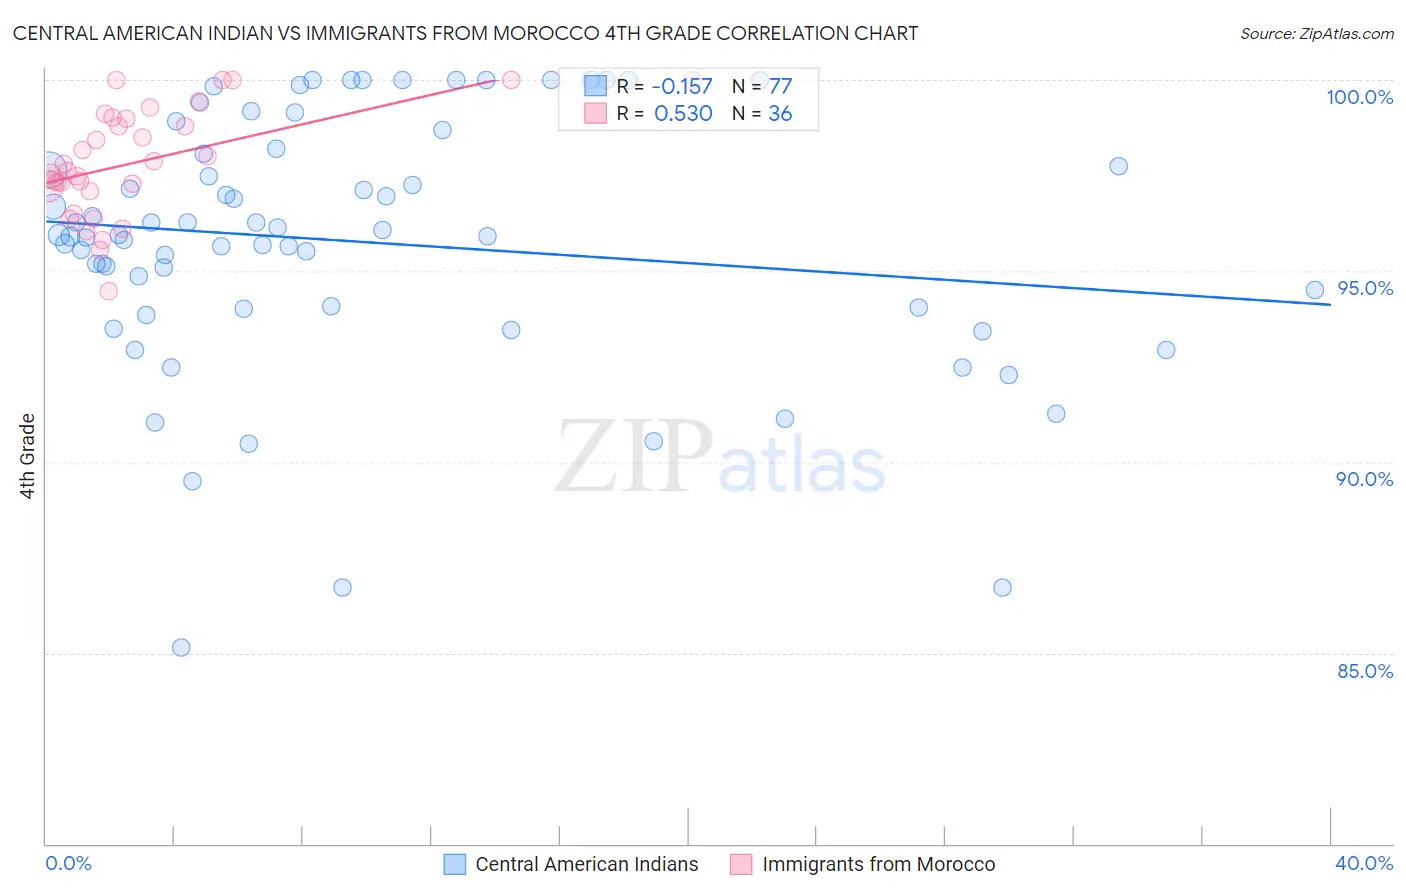
Central American Indian vs Immigrants from Morocco 4th Grade Correlation Chart
The statistical analysis conducted on geographies consisting of 326,140,921 people shows a poor negative correlation between the proportion of Central American Indians and percentage of population with at least 4th grade education in the United States with a correlation coefficient (R) of -0.157 and weighted average of 96.2%. Similarly, the statistical analysis conducted on geographies consisting of 178,910,634 people shows a substantial positive correlation between the proportion of Immigrants from Morocco and percentage of population with at least 4th grade education in the United States with a correlation coefficient (R) of 0.530 and weighted average of 97.3%, a difference of 1.2%.
4th Grade Correlation Summary
| Measurement | Central American Indian | Immigrants from Morocco |
| Minimum | 85.1% | 94.5% |
| Maximum | 100.0% | 100.0% |
| Range | 14.9% | 5.5% |
| Mean | 95.8% | 97.9% |
| Median | 95.9% | 97.7% |
| Interquartile 25% (IQ1) | 94.0% | 97.1% |
| Interquartile 75% (IQ3) | 98.1% | 99.0% |
| Interquartile Range (IQR) | 4.1% | 1.8% |
| Standard Deviation (Sample) | 3.3% | 1.4% |
| Standard Deviation (Population) | 3.3% | 1.4% |
Similar Demographics by 4th Grade
Demographics Similar to Central American Indians by 4th Grade
In terms of 4th grade, the demographic groups most similar to Central American Indians are Immigrants from Ecuador (96.2%, a difference of 0.040%), Immigrants from the Azores (96.1%, a difference of 0.040%), Vietnamese (96.2%, a difference of 0.050%), Nicaraguan (96.2%, a difference of 0.050%), and Indonesian (96.2%, a difference of 0.060%).
| Demographics | Rating | Rank | 4th Grade |
| Immigrants | Burma/Myanmar | 0.0 /100 | #310 | Tragic 96.3% |
| Immigrants | Bangladesh | 0.0 /100 | #311 | Tragic 96.2% |
| Cape Verdeans | 0.0 /100 | #312 | Tragic 96.2% |
| Indonesians | 0.0 /100 | #313 | Tragic 96.2% |
| Vietnamese | 0.0 /100 | #314 | Tragic 96.2% |
| Nicaraguans | 0.0 /100 | #315 | Tragic 96.2% |
| Immigrants | Ecuador | 0.0 /100 | #316 | Tragic 96.2% |
| Central American Indians | 0.0 /100 | #317 | Tragic 96.2% |
| Immigrants | Azores | 0.0 /100 | #318 | Tragic 96.1% |
| Belizeans | 0.0 /100 | #319 | Tragic 96.1% |
| Bangladeshis | 0.0 /100 | #320 | Tragic 96.1% |
| Japanese | 0.0 /100 | #321 | Tragic 96.0% |
| Immigrants | Vietnam | 0.0 /100 | #322 | Tragic 96.0% |
| Immigrants | Nicaragua | 0.0 /100 | #323 | Tragic 96.0% |
| Immigrants | Belize | 0.0 /100 | #324 | Tragic 96.0% |
Demographics Similar to Immigrants from Morocco by 4th Grade
In terms of 4th grade, the demographic groups most similar to Immigrants from Morocco are Samoan (97.3%, a difference of 0.0%), Immigrants from Nepal (97.3%, a difference of 0.010%), Sierra Leonean (97.3%, a difference of 0.010%), Iraqi (97.3%, a difference of 0.010%), and Tohono O'odham (97.3%, a difference of 0.020%).
| Demographics | Rating | Rank | 4th Grade |
| Immigrants | Bahamas | 10.8 /100 | #208 | Poor 97.3% |
| Laotians | 9.3 /100 | #209 | Tragic 97.3% |
| Immigrants | Oceania | 9.1 /100 | #210 | Tragic 97.3% |
| Sudanese | 9.0 /100 | #211 | Tragic 97.3% |
| Tohono O'odham | 8.4 /100 | #212 | Tragic 97.3% |
| Costa Ricans | 8.3 /100 | #213 | Tragic 97.3% |
| Immigrants | Nepal | 7.7 /100 | #214 | Tragic 97.3% |
| Immigrants | Morocco | 7.1 /100 | #215 | Tragic 97.3% |
| Samoans | 6.8 /100 | #216 | Tragic 97.3% |
| Sierra Leoneans | 6.5 /100 | #217 | Tragic 97.3% |
| Iraqis | 6.3 /100 | #218 | Tragic 97.3% |
| Tongans | 5.8 /100 | #219 | Tragic 97.3% |
| South American Indians | 5.5 /100 | #220 | Tragic 97.3% |
| Immigrants | Panama | 5.4 /100 | #221 | Tragic 97.3% |
| Immigrants | Lebanon | 5.1 /100 | #222 | Tragic 97.3% |