Carpatho Rusyn vs Seminole 11th Grade
COMPARE
Carpatho Rusyn
Seminole
11th Grade
11th Grade Comparison
Carpatho Rusyns
Seminole
94.8%
11TH GRADE
100.0/ 100
METRIC RATING
5th/ 347
METRIC RANK
91.5%
11TH GRADE
1.2/ 100
METRIC RATING
246th/ 347
METRIC RANK
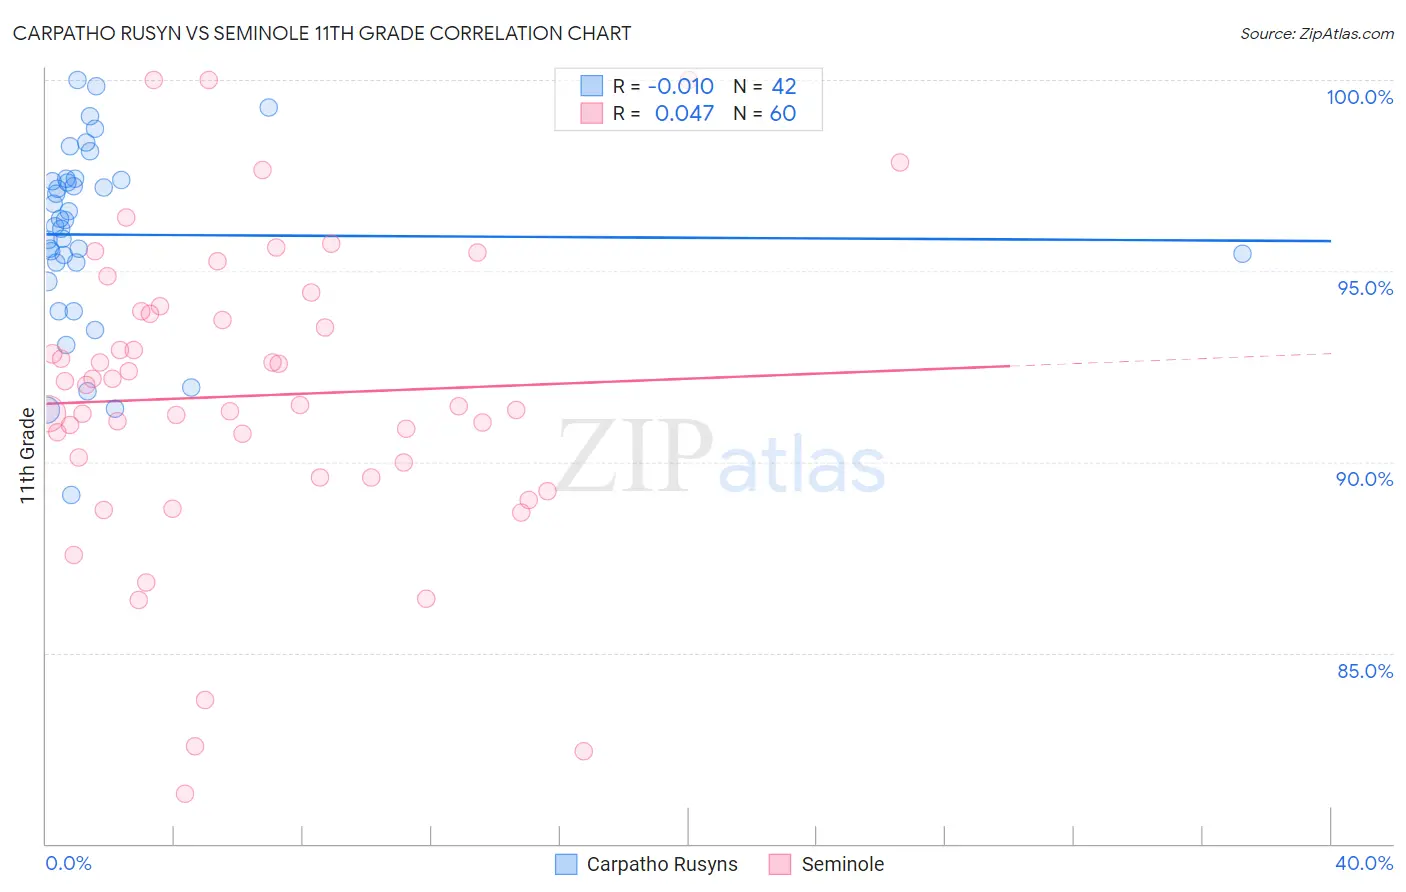
Carpatho Rusyn vs Seminole 11th Grade Correlation Chart
The statistical analysis conducted on geographies consisting of 58,871,690 people shows no correlation between the proportion of Carpatho Rusyns and percentage of population with at least 11th grade education in the United States with a correlation coefficient (R) of -0.010 and weighted average of 94.8%. Similarly, the statistical analysis conducted on geographies consisting of 118,314,042 people shows no correlation between the proportion of Seminole and percentage of population with at least 11th grade education in the United States with a correlation coefficient (R) of 0.047 and weighted average of 91.5%, a difference of 3.6%.
11th Grade Correlation Summary
| Measurement | Carpatho Rusyn | Seminole |
| Minimum | 89.1% | 81.3% |
| Maximum | 100.0% | 100.0% |
| Range | 10.9% | 18.7% |
| Mean | 95.9% | 91.7% |
| Median | 96.3% | 91.8% |
| Interquartile 25% (IQ1) | 95.2% | 89.8% |
| Interquartile 75% (IQ3) | 97.4% | 93.9% |
| Interquartile Range (IQR) | 2.1% | 4.1% |
| Standard Deviation (Sample) | 2.4% | 3.9% |
| Standard Deviation (Population) | 2.4% | 3.9% |
Similar Demographics by 11th Grade
Demographics Similar to Carpatho Rusyns by 11th Grade
In terms of 11th grade, the demographic groups most similar to Carpatho Rusyns are Lithuanian (94.8%, a difference of 0.050%), Slovak (94.9%, a difference of 0.060%), Slovene (94.9%, a difference of 0.080%), Swedish (94.9%, a difference of 0.10%), and Polish (94.8%, a difference of 0.10%).
| Demographics | Rating | Rank | 11th Grade |
| Norwegians | 100.0 /100 | #1 | Exceptional 95.2% |
| Swedes | 100.0 /100 | #2 | Exceptional 94.9% |
| Slovenes | 100.0 /100 | #3 | Exceptional 94.9% |
| Slovaks | 100.0 /100 | #4 | Exceptional 94.9% |
| Carpatho Rusyns | 100.0 /100 | #5 | Exceptional 94.8% |
| Lithuanians | 100.0 /100 | #6 | Exceptional 94.8% |
| Poles | 100.0 /100 | #7 | Exceptional 94.8% |
| Croatians | 100.0 /100 | #8 | Exceptional 94.7% |
| Danes | 100.0 /100 | #9 | Exceptional 94.7% |
| Finns | 100.0 /100 | #10 | Exceptional 94.7% |
| Germans | 100.0 /100 | #11 | Exceptional 94.7% |
| Latvians | 100.0 /100 | #12 | Exceptional 94.7% |
| Chinese | 100.0 /100 | #13 | Exceptional 94.6% |
| Eastern Europeans | 100.0 /100 | #14 | Exceptional 94.6% |
| Bulgarians | 100.0 /100 | #15 | Exceptional 94.5% |
Demographics Similar to Seminole by 11th Grade
In terms of 11th grade, the demographic groups most similar to Seminole are African (91.5%, a difference of 0.030%), Immigrants from Philippines (91.5%, a difference of 0.040%), Immigrants from Uzbekistan (91.5%, a difference of 0.040%), Immigrants from Thailand (91.6%, a difference of 0.050%), and Senegalese (91.6%, a difference of 0.050%).
| Demographics | Rating | Rank | 11th Grade |
| Hopi | 2.5 /100 | #239 | Tragic 91.7% |
| South Americans | 2.0 /100 | #240 | Tragic 91.6% |
| Bahamians | 1.8 /100 | #241 | Tragic 91.6% |
| Immigrants | Middle Africa | 1.6 /100 | #242 | Tragic 91.6% |
| Immigrants | Thailand | 1.4 /100 | #243 | Tragic 91.6% |
| Senegalese | 1.4 /100 | #244 | Tragic 91.6% |
| Africans | 1.3 /100 | #245 | Tragic 91.5% |
| Seminole | 1.2 /100 | #246 | Tragic 91.5% |
| Immigrants | Philippines | 1.0 /100 | #247 | Tragic 91.5% |
| Immigrants | Uzbekistan | 1.0 /100 | #248 | Tragic 91.5% |
| Peruvians | 1.0 /100 | #249 | Tragic 91.5% |
| Ghanaians | 0.9 /100 | #250 | Tragic 91.5% |
| Immigrants | Costa Rica | 0.9 /100 | #251 | Tragic 91.4% |
| Immigrants | Nigeria | 0.8 /100 | #252 | Tragic 91.4% |
| Immigrants | South America | 0.8 /100 | #253 | Tragic 91.4% |