Carpatho Rusyn vs Eastern European 11th Grade
COMPARE
Carpatho Rusyn
Eastern European
11th Grade
11th Grade Comparison
Carpatho Rusyns
Eastern Europeans
94.8%
11TH GRADE
100.0/ 100
METRIC RATING
5th/ 347
METRIC RANK
94.6%
11TH GRADE
100.0/ 100
METRIC RATING
14th/ 347
METRIC RANK
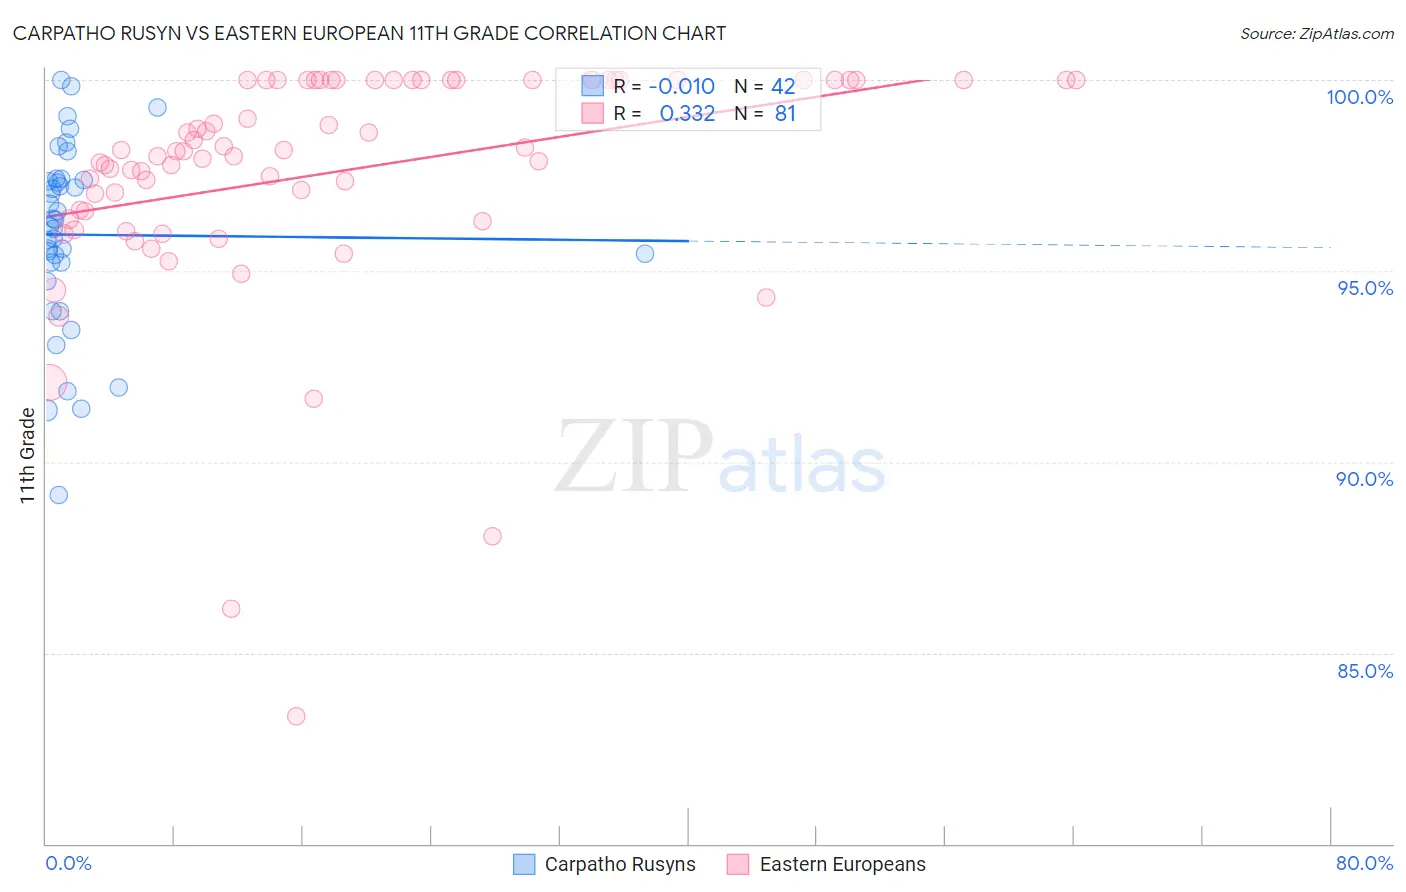
Carpatho Rusyn vs Eastern European 11th Grade Correlation Chart
The statistical analysis conducted on geographies consisting of 58,871,690 people shows no correlation between the proportion of Carpatho Rusyns and percentage of population with at least 11th grade education in the United States with a correlation coefficient (R) of -0.010 and weighted average of 94.8%. Similarly, the statistical analysis conducted on geographies consisting of 461,247,615 people shows a mild positive correlation between the proportion of Eastern Europeans and percentage of population with at least 11th grade education in the United States with a correlation coefficient (R) of 0.332 and weighted average of 94.6%, a difference of 0.30%.
11th Grade Correlation Summary
| Measurement | Carpatho Rusyn | Eastern European |
| Minimum | 89.1% | 83.3% |
| Maximum | 100.0% | 100.0% |
| Range | 10.9% | 16.7% |
| Mean | 95.9% | 97.6% |
| Median | 96.3% | 98.1% |
| Interquartile 25% (IQ1) | 95.2% | 96.5% |
| Interquartile 75% (IQ3) | 97.4% | 100.0% |
| Interquartile Range (IQR) | 2.1% | 3.5% |
| Standard Deviation (Sample) | 2.4% | 3.0% |
| Standard Deviation (Population) | 2.4% | 3.0% |
Demographics Similar to Carpatho Rusyns and Eastern Europeans by 11th Grade
In terms of 11th grade, the demographic groups most similar to Carpatho Rusyns are Lithuanian (94.8%, a difference of 0.050%), Slovak (94.9%, a difference of 0.060%), Slovene (94.9%, a difference of 0.080%), Swedish (94.9%, a difference of 0.10%), and Polish (94.8%, a difference of 0.10%). Similarly, the demographic groups most similar to Eastern Europeans are Chinese (94.6%, a difference of 0.060%), Bulgarian (94.5%, a difference of 0.080%), Immigrants from India (94.5%, a difference of 0.080%), Luxembourger (94.5%, a difference of 0.080%), and Maltese (94.5%, a difference of 0.090%).
| Demographics | Rating | Rank | 11th Grade |
| Norwegians | 100.0 /100 | #1 | Exceptional 95.2% |
| Swedes | 100.0 /100 | #2 | Exceptional 94.9% |
| Slovenes | 100.0 /100 | #3 | Exceptional 94.9% |
| Slovaks | 100.0 /100 | #4 | Exceptional 94.9% |
| Carpatho Rusyns | 100.0 /100 | #5 | Exceptional 94.8% |
| Lithuanians | 100.0 /100 | #6 | Exceptional 94.8% |
| Poles | 100.0 /100 | #7 | Exceptional 94.8% |
| Croatians | 100.0 /100 | #8 | Exceptional 94.7% |
| Danes | 100.0 /100 | #9 | Exceptional 94.7% |
| Finns | 100.0 /100 | #10 | Exceptional 94.7% |
| Germans | 100.0 /100 | #11 | Exceptional 94.7% |
| Latvians | 100.0 /100 | #12 | Exceptional 94.7% |
| Chinese | 100.0 /100 | #13 | Exceptional 94.6% |
| Eastern Europeans | 100.0 /100 | #14 | Exceptional 94.6% |
| Bulgarians | 100.0 /100 | #15 | Exceptional 94.5% |
| Immigrants | India | 100.0 /100 | #16 | Exceptional 94.5% |
| Luxembourgers | 100.0 /100 | #17 | Exceptional 94.5% |
| Maltese | 100.0 /100 | #18 | Exceptional 94.5% |
| Scandinavians | 100.0 /100 | #19 | Exceptional 94.5% |
| Italians | 100.0 /100 | #20 | Exceptional 94.5% |