Cape Verdean vs Chilean 3rd Grade
COMPARE
Cape Verdean
Chilean
3rd Grade
3rd Grade Comparison
Cape Verdeans
Chileans
96.6%
3RD GRADE
0.0/ 100
METRIC RATING
310th/ 347
METRIC RANK
97.8%
3RD GRADE
55.3/ 100
METRIC RATING
167th/ 347
METRIC RANK
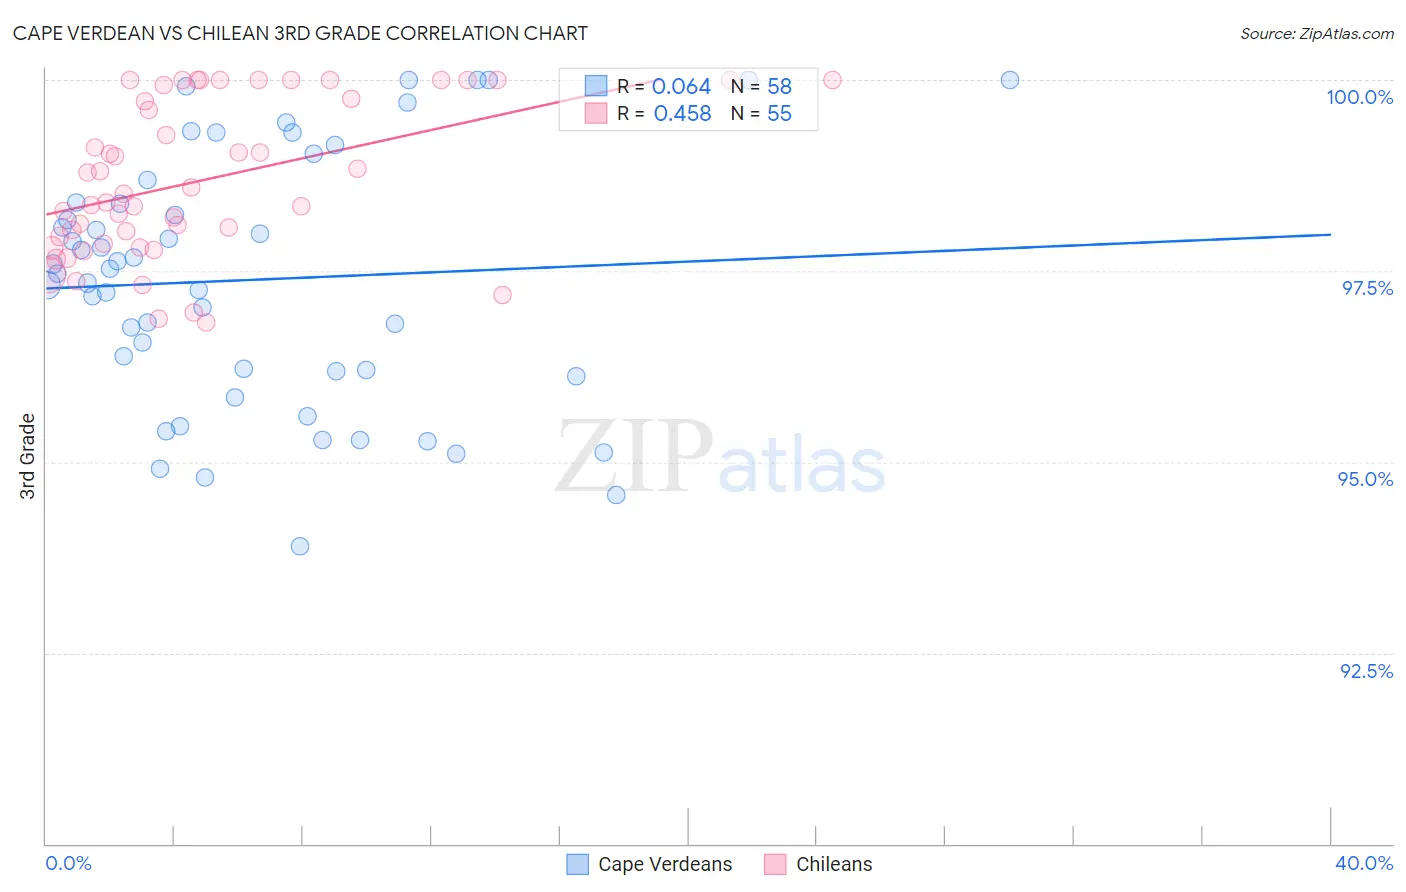
Cape Verdean vs Chilean 3rd Grade Correlation Chart
The statistical analysis conducted on geographies consisting of 107,537,955 people shows a slight positive correlation between the proportion of Cape Verdeans and percentage of population with at least 3rd grade education in the United States with a correlation coefficient (R) of 0.064 and weighted average of 96.6%. Similarly, the statistical analysis conducted on geographies consisting of 256,684,337 people shows a moderate positive correlation between the proportion of Chileans and percentage of population with at least 3rd grade education in the United States with a correlation coefficient (R) of 0.458 and weighted average of 97.8%, a difference of 1.2%.
3rd Grade Correlation Summary
| Measurement | Cape Verdean | Chilean |
| Minimum | 93.9% | 96.8% |
| Maximum | 100.0% | 100.0% |
| Range | 6.1% | 3.2% |
| Mean | 97.4% | 98.7% |
| Median | 97.5% | 98.5% |
| Interquartile 25% (IQ1) | 96.2% | 97.9% |
| Interquartile 75% (IQ3) | 98.4% | 99.9% |
| Interquartile Range (IQR) | 2.2% | 2.1% |
| Standard Deviation (Sample) | 1.6% | 1.0% |
| Standard Deviation (Population) | 1.6% | 1.00% |
Similar Demographics by 3rd Grade
Demographics Similar to Cape Verdeans by 3rd Grade
In terms of 3rd grade, the demographic groups most similar to Cape Verdeans are Nicaraguan (96.7%, a difference of 0.030%), Immigrants from Haiti (96.7%, a difference of 0.030%), Sri Lankan (96.7%, a difference of 0.030%), Immigrants from Guyana (96.6%, a difference of 0.030%), and Immigrants from Laos (96.6%, a difference of 0.040%).
| Demographics | Rating | Rank | 3rd Grade |
| Ecuadorians | 0.0 /100 | #303 | Tragic 96.7% |
| Immigrants | Caribbean | 0.0 /100 | #304 | Tragic 96.7% |
| Central American Indians | 0.0 /100 | #305 | Tragic 96.7% |
| Guyanese | 0.0 /100 | #306 | Tragic 96.7% |
| Nicaraguans | 0.0 /100 | #307 | Tragic 96.7% |
| Immigrants | Haiti | 0.0 /100 | #308 | Tragic 96.7% |
| Sri Lankans | 0.0 /100 | #309 | Tragic 96.7% |
| Cape Verdeans | 0.0 /100 | #310 | Tragic 96.6% |
| Immigrants | Guyana | 0.0 /100 | #311 | Tragic 96.6% |
| Immigrants | Laos | 0.0 /100 | #312 | Tragic 96.6% |
| Immigrants | Ecuador | 0.0 /100 | #313 | Tragic 96.6% |
| Belizeans | 0.0 /100 | #314 | Tragic 96.6% |
| Immigrants | Azores | 0.0 /100 | #315 | Tragic 96.6% |
| Immigrants | Burma/Myanmar | 0.0 /100 | #316 | Tragic 96.6% |
| Immigrants | Bangladesh | 0.0 /100 | #317 | Tragic 96.6% |
Demographics Similar to Chileans by 3rd Grade
In terms of 3rd grade, the demographic groups most similar to Chileans are Immigrants from Bosnia and Herzegovina (97.8%, a difference of 0.0%), Ugandan (97.8%, a difference of 0.0%), Dutch West Indian (97.8%, a difference of 0.0%), Immigrants from Spain (97.8%, a difference of 0.0%), and Immigrants from Iran (97.8%, a difference of 0.010%).
| Demographics | Rating | Rank | 3rd Grade |
| Immigrants | Iran | 59.1 /100 | #160 | Average 97.8% |
| Albanians | 58.8 /100 | #161 | Average 97.8% |
| Immigrants | Jordan | 57.9 /100 | #162 | Average 97.8% |
| Marshallese | 57.2 /100 | #163 | Average 97.8% |
| Immigrants | Bosnia and Herzegovina | 56.2 /100 | #164 | Average 97.8% |
| Ugandans | 56.1 /100 | #165 | Average 97.8% |
| Dutch West Indians | 55.5 /100 | #166 | Average 97.8% |
| Chileans | 55.3 /100 | #167 | Average 97.8% |
| Immigrants | Spain | 54.3 /100 | #168 | Average 97.8% |
| Comanche | 53.8 /100 | #169 | Average 97.8% |
| Brazilians | 53.7 /100 | #170 | Average 97.8% |
| Kenyans | 51.8 /100 | #171 | Average 97.8% |
| Spanish Americans | 51.8 /100 | #172 | Average 97.8% |
| Immigrants | Korea | 50.9 /100 | #173 | Average 97.8% |
| Navajo | 50.0 /100 | #174 | Average 97.8% |