Cape Verdean vs Immigrants from Cameroon 2nd Grade
COMPARE
Cape Verdean
Immigrants from Cameroon
2nd Grade
2nd Grade Comparison
Cape Verdeans
Immigrants from Cameroon
96.8%
2ND GRADE
0.0/ 100
METRIC RATING
312th/ 347
METRIC RANK
97.4%
2ND GRADE
0.2/ 100
METRIC RATING
271st/ 347
METRIC RANK
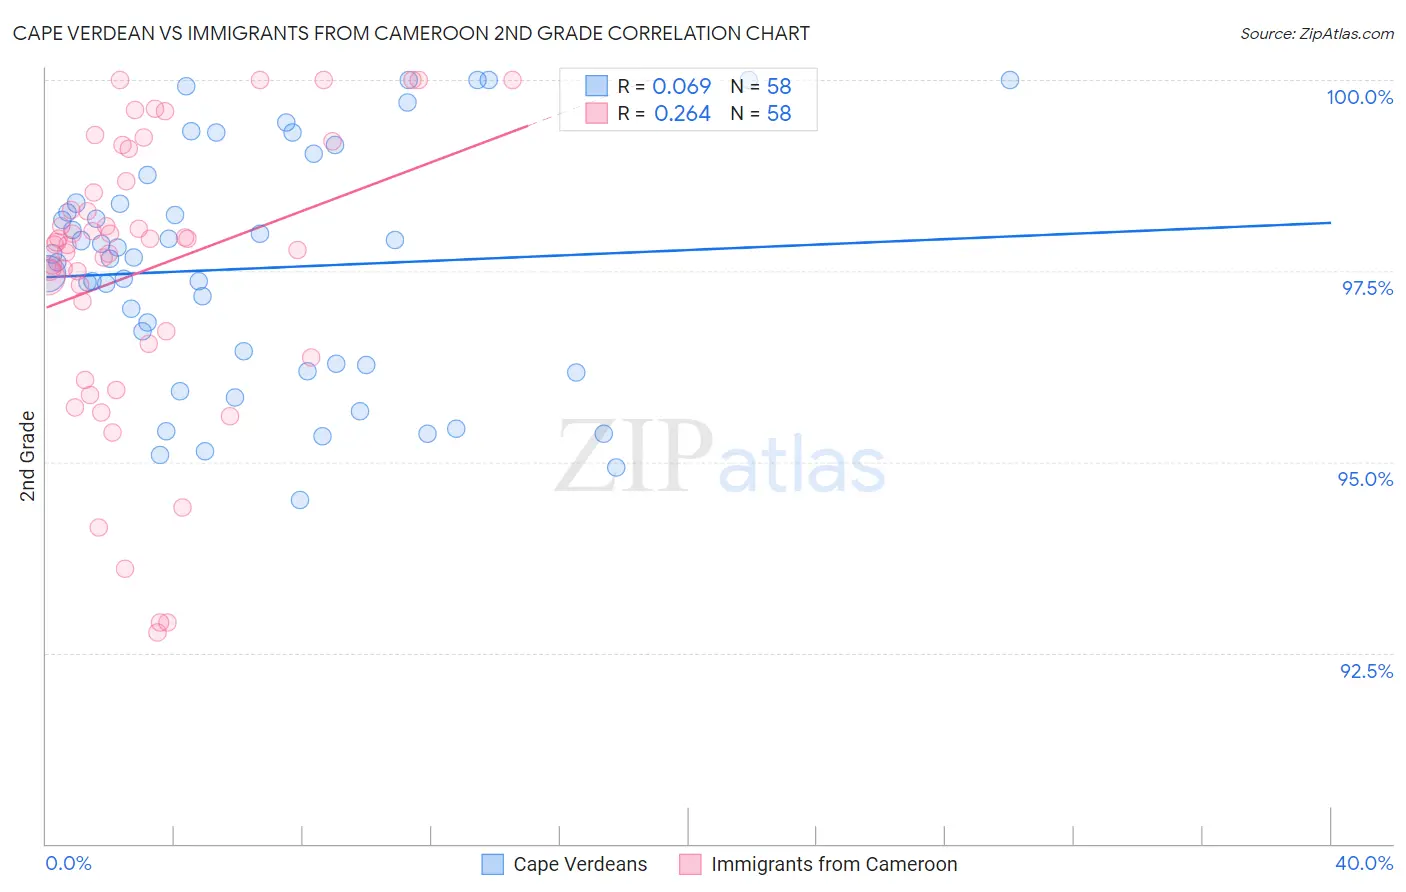
Cape Verdean vs Immigrants from Cameroon 2nd Grade Correlation Chart
The statistical analysis conducted on geographies consisting of 107,537,955 people shows a slight positive correlation between the proportion of Cape Verdeans and percentage of population with at least 2nd grade education in the United States with a correlation coefficient (R) of 0.069 and weighted average of 96.8%. Similarly, the statistical analysis conducted on geographies consisting of 130,752,798 people shows a weak positive correlation between the proportion of Immigrants from Cameroon and percentage of population with at least 2nd grade education in the United States with a correlation coefficient (R) of 0.264 and weighted average of 97.4%, a difference of 0.58%.
2nd Grade Correlation Summary
| Measurement | Cape Verdean | Immigrants from Cameroon |
| Minimum | 94.5% | 92.8% |
| Maximum | 100.0% | 100.0% |
| Range | 5.5% | 7.2% |
| Mean | 97.5% | 97.5% |
| Median | 97.7% | 97.9% |
| Interquartile 25% (IQ1) | 96.3% | 96.6% |
| Interquartile 75% (IQ3) | 98.4% | 98.7% |
| Interquartile Range (IQR) | 2.1% | 2.1% |
| Standard Deviation (Sample) | 1.5% | 1.9% |
| Standard Deviation (Population) | 1.5% | 1.8% |
Similar Demographics by 2nd Grade
Demographics Similar to Cape Verdeans by 2nd Grade
In terms of 2nd grade, the demographic groups most similar to Cape Verdeans are Sri Lankan (96.8%, a difference of 0.010%), Guyanese (96.8%, a difference of 0.010%), Immigrants from Haiti (96.8%, a difference of 0.020%), Belizean (96.8%, a difference of 0.020%), and Hispanic or Latino (96.8%, a difference of 0.020%).
| Demographics | Rating | Rank | 2nd Grade |
| Nicaraguans | 0.0 /100 | #305 | Tragic 96.9% |
| Immigrants | Somalia | 0.0 /100 | #306 | Tragic 96.9% |
| Immigrants | Azores | 0.0 /100 | #307 | Tragic 96.8% |
| Immigrants | Haiti | 0.0 /100 | #308 | Tragic 96.8% |
| Belizeans | 0.0 /100 | #309 | Tragic 96.8% |
| Sri Lankans | 0.0 /100 | #310 | Tragic 96.8% |
| Guyanese | 0.0 /100 | #311 | Tragic 96.8% |
| Cape Verdeans | 0.0 /100 | #312 | Tragic 96.8% |
| Hispanics or Latinos | 0.0 /100 | #313 | Tragic 96.8% |
| Immigrants | Ecuador | 0.0 /100 | #314 | Tragic 96.8% |
| Immigrants | Belize | 0.0 /100 | #315 | Tragic 96.8% |
| Hondurans | 0.0 /100 | #316 | Tragic 96.7% |
| Immigrants | Laos | 0.0 /100 | #317 | Tragic 96.7% |
| Indonesians | 0.0 /100 | #318 | Tragic 96.7% |
| Immigrants | Nicaragua | 0.0 /100 | #319 | Tragic 96.7% |
Demographics Similar to Immigrants from Cameroon by 2nd Grade
In terms of 2nd grade, the demographic groups most similar to Immigrants from Cameroon are Immigrants from Peru (97.4%, a difference of 0.010%), Immigrants from Jamaica (97.4%, a difference of 0.020%), Immigrants from Bolivia (97.4%, a difference of 0.020%), Ghanaian (97.4%, a difference of 0.020%), and Immigrants from China (97.3%, a difference of 0.030%).
| Demographics | Rating | Rank | 2nd Grade |
| Immigrants | Liberia | 0.4 /100 | #264 | Tragic 97.4% |
| Immigrants | South America | 0.4 /100 | #265 | Tragic 97.4% |
| Immigrants | Sierra Leone | 0.4 /100 | #266 | Tragic 97.4% |
| Cubans | 0.3 /100 | #267 | Tragic 97.4% |
| Immigrants | Nigeria | 0.3 /100 | #268 | Tragic 97.4% |
| West Indians | 0.3 /100 | #269 | Tragic 97.4% |
| Immigrants | Jamaica | 0.2 /100 | #270 | Tragic 97.4% |
| Immigrants | Cameroon | 0.2 /100 | #271 | Tragic 97.4% |
| Immigrants | Peru | 0.1 /100 | #272 | Tragic 97.4% |
| Immigrants | Bolivia | 0.1 /100 | #273 | Tragic 97.4% |
| Ghanaians | 0.1 /100 | #274 | Tragic 97.4% |
| Immigrants | China | 0.1 /100 | #275 | Tragic 97.3% |
| Immigrants | Philippines | 0.1 /100 | #276 | Tragic 97.3% |
| Immigrants | Western Africa | 0.1 /100 | #277 | Tragic 97.3% |
| Immigrants | Uzbekistan | 0.1 /100 | #278 | Tragic 97.3% |