Cape Verdean vs Bahamian 2nd Grade
COMPARE
Cape Verdean
Bahamian
2nd Grade
2nd Grade Comparison
Cape Verdeans
Bahamians
96.8%
2ND GRADE
0.0/ 100
METRIC RATING
312th/ 347
METRIC RANK
97.7%
2ND GRADE
6.8/ 100
METRIC RATING
215th/ 347
METRIC RANK
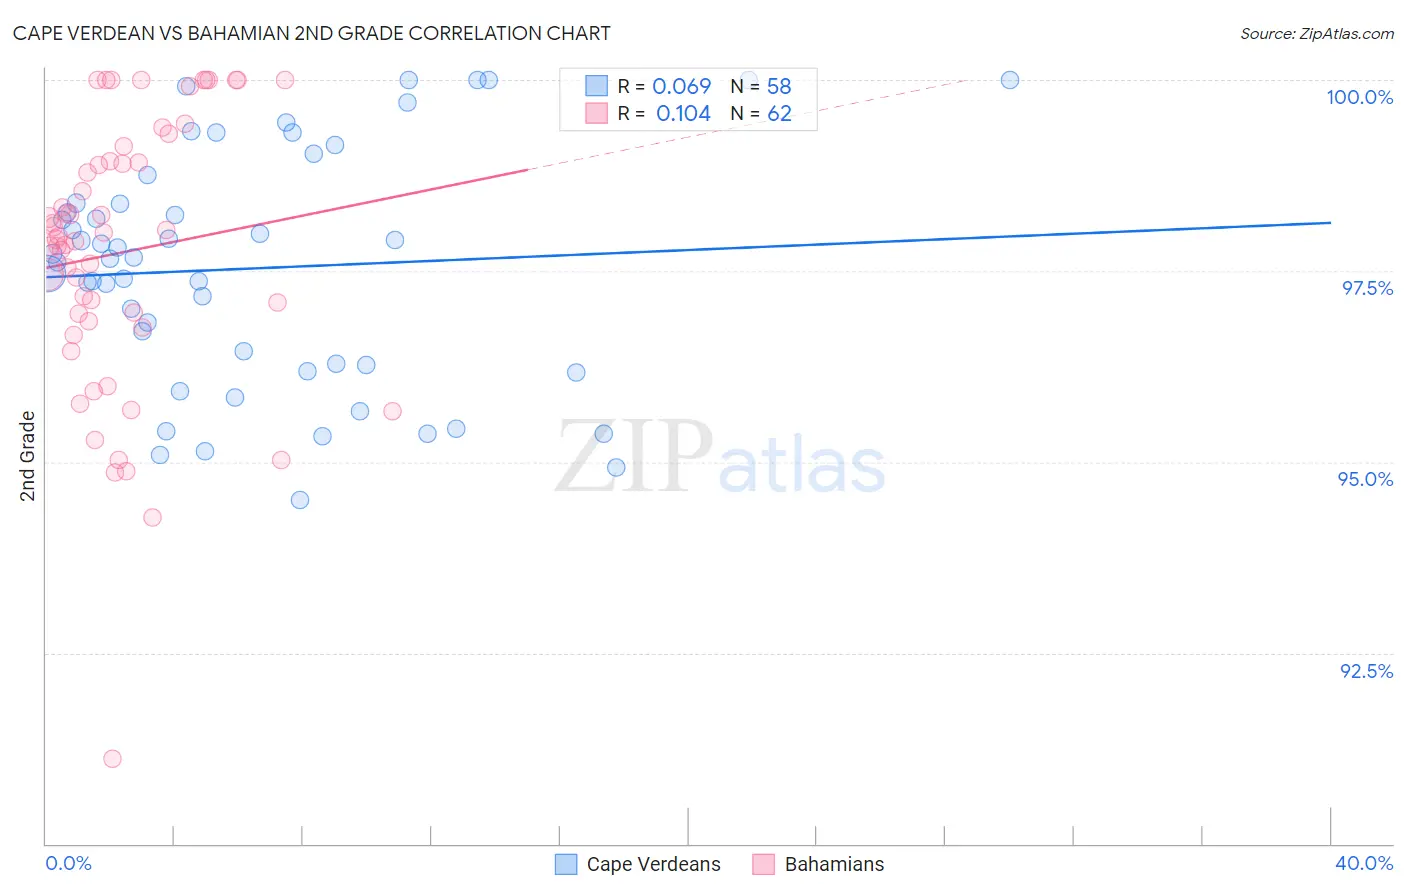
Cape Verdean vs Bahamian 2nd Grade Correlation Chart
The statistical analysis conducted on geographies consisting of 107,537,955 people shows a slight positive correlation between the proportion of Cape Verdeans and percentage of population with at least 2nd grade education in the United States with a correlation coefficient (R) of 0.069 and weighted average of 96.8%. Similarly, the statistical analysis conducted on geographies consisting of 112,673,855 people shows a poor positive correlation between the proportion of Bahamians and percentage of population with at least 2nd grade education in the United States with a correlation coefficient (R) of 0.104 and weighted average of 97.7%, a difference of 0.88%.
2nd Grade Correlation Summary
| Measurement | Cape Verdean | Bahamian |
| Minimum | 94.5% | 91.1% |
| Maximum | 100.0% | 100.0% |
| Range | 5.5% | 8.9% |
| Mean | 97.5% | 97.7% |
| Median | 97.7% | 97.9% |
| Interquartile 25% (IQ1) | 96.3% | 96.8% |
| Interquartile 75% (IQ3) | 98.4% | 98.9% |
| Interquartile Range (IQR) | 2.1% | 2.1% |
| Standard Deviation (Sample) | 1.5% | 1.8% |
| Standard Deviation (Population) | 1.5% | 1.8% |
Similar Demographics by 2nd Grade
Demographics Similar to Cape Verdeans by 2nd Grade
In terms of 2nd grade, the demographic groups most similar to Cape Verdeans are Sri Lankan (96.8%, a difference of 0.010%), Guyanese (96.8%, a difference of 0.010%), Immigrants from Haiti (96.8%, a difference of 0.020%), Belizean (96.8%, a difference of 0.020%), and Hispanic or Latino (96.8%, a difference of 0.020%).
| Demographics | Rating | Rank | 2nd Grade |
| Nicaraguans | 0.0 /100 | #305 | Tragic 96.9% |
| Immigrants | Somalia | 0.0 /100 | #306 | Tragic 96.9% |
| Immigrants | Azores | 0.0 /100 | #307 | Tragic 96.8% |
| Immigrants | Haiti | 0.0 /100 | #308 | Tragic 96.8% |
| Belizeans | 0.0 /100 | #309 | Tragic 96.8% |
| Sri Lankans | 0.0 /100 | #310 | Tragic 96.8% |
| Guyanese | 0.0 /100 | #311 | Tragic 96.8% |
| Cape Verdeans | 0.0 /100 | #312 | Tragic 96.8% |
| Hispanics or Latinos | 0.0 /100 | #313 | Tragic 96.8% |
| Immigrants | Ecuador | 0.0 /100 | #314 | Tragic 96.8% |
| Immigrants | Belize | 0.0 /100 | #315 | Tragic 96.8% |
| Hondurans | 0.0 /100 | #316 | Tragic 96.7% |
| Immigrants | Laos | 0.0 /100 | #317 | Tragic 96.7% |
| Indonesians | 0.0 /100 | #318 | Tragic 96.7% |
| Immigrants | Nicaragua | 0.0 /100 | #319 | Tragic 96.7% |
Demographics Similar to Bahamians by 2nd Grade
In terms of 2nd grade, the demographic groups most similar to Bahamians are Samoan (97.7%, a difference of 0.0%), South American Indian (97.7%, a difference of 0.0%), Uruguayan (97.7%, a difference of 0.010%), Immigrants from Bahamas (97.7%, a difference of 0.020%), and Moroccan (97.7%, a difference of 0.020%).
| Demographics | Rating | Rank | 2nd Grade |
| Immigrants | Northern Africa | 12.3 /100 | #208 | Poor 97.7% |
| Immigrants | Oceania | 10.9 /100 | #209 | Poor 97.7% |
| Costa Ricans | 10.5 /100 | #210 | Poor 97.7% |
| Laotians | 9.9 /100 | #211 | Tragic 97.7% |
| Immigrants | Bahamas | 8.4 /100 | #212 | Tragic 97.7% |
| Moroccans | 8.2 /100 | #213 | Tragic 97.7% |
| Samoans | 7.1 /100 | #214 | Tragic 97.7% |
| Bahamians | 6.8 /100 | #215 | Tragic 97.7% |
| South American Indians | 6.7 /100 | #216 | Tragic 97.7% |
| Uruguayans | 6.2 /100 | #217 | Tragic 97.7% |
| Sudanese | 5.7 /100 | #218 | Tragic 97.7% |
| Immigrants | Panama | 5.1 /100 | #219 | Tragic 97.6% |
| Immigrants | Morocco | 5.0 /100 | #220 | Tragic 97.6% |
| Iraqis | 4.6 /100 | #221 | Tragic 97.6% |
| Immigrants | Sudan | 4.5 /100 | #222 | Tragic 97.6% |