Canadian vs Immigrants from Laos No Schooling Completed
COMPARE
Canadian
Immigrants from Laos
No Schooling Completed
No Schooling Completed Comparison
Canadians
Immigrants from Laos
1.7%
NO SCHOOLING COMPLETED
99.7/ 100
METRIC RATING
66th/ 347
METRIC RANK
3.1%
NO SCHOOLING COMPLETED
0.0/ 100
METRIC RATING
321st/ 347
METRIC RANK
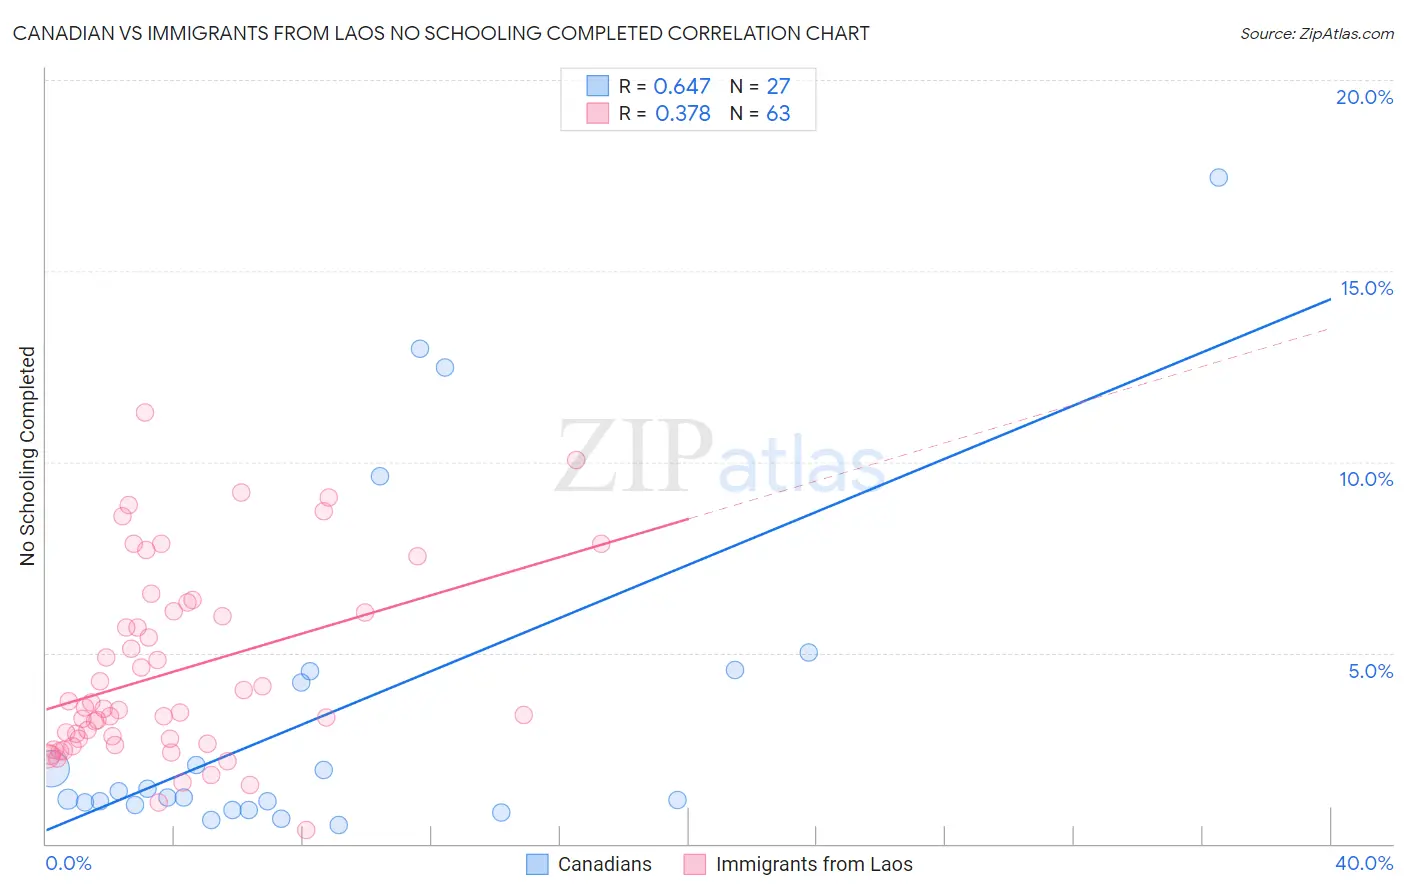
Canadian vs Immigrants from Laos No Schooling Completed Correlation Chart
The statistical analysis conducted on geographies consisting of 430,389,571 people shows a significant positive correlation between the proportion of Canadians and percentage of population with no schooling in the United States with a correlation coefficient (R) of 0.647 and weighted average of 1.7%. Similarly, the statistical analysis conducted on geographies consisting of 200,828,935 people shows a mild positive correlation between the proportion of Immigrants from Laos and percentage of population with no schooling in the United States with a correlation coefficient (R) of 0.378 and weighted average of 3.1%, a difference of 88.1%.
No Schooling Completed Correlation Summary
| Measurement | Canadian | Immigrants from Laos |
| Minimum | 0.49% | 0.36% |
| Maximum | 17.5% | 11.3% |
| Range | 17.0% | 10.9% |
| Mean | 3.4% | 4.5% |
| Median | 1.2% | 3.5% |
| Interquartile 25% (IQ1) | 1.0% | 2.6% |
| Interquartile 75% (IQ3) | 4.5% | 6.1% |
| Interquartile Range (IQR) | 3.5% | 3.5% |
| Standard Deviation (Sample) | 4.4% | 2.5% |
| Standard Deviation (Population) | 4.4% | 2.5% |
Similar Demographics by No Schooling Completed
Demographics Similar to Canadians by No Schooling Completed
In terms of no schooling completed, the demographic groups most similar to Canadians are Serbian (1.7%, a difference of 0.14%), New Zealander (1.7%, a difference of 0.18%), Immigrants from Austria (1.7%, a difference of 0.19%), Russian (1.7%, a difference of 0.34%), and Immigrants from Northern Europe (1.7%, a difference of 0.38%).
| Demographics | Rating | Rank | No Schooling Completed |
| Slavs | 99.8 /100 | #59 | Exceptional 1.7% |
| Americans | 99.8 /100 | #60 | Exceptional 1.7% |
| Tsimshian | 99.8 /100 | #61 | Exceptional 1.7% |
| Immigrants | Northern Europe | 99.8 /100 | #62 | Exceptional 1.7% |
| Russians | 99.8 /100 | #63 | Exceptional 1.7% |
| New Zealanders | 99.7 /100 | #64 | Exceptional 1.7% |
| Serbians | 99.7 /100 | #65 | Exceptional 1.7% |
| Canadians | 99.7 /100 | #66 | Exceptional 1.7% |
| Immigrants | Austria | 99.7 /100 | #67 | Exceptional 1.7% |
| Immigrants | Lithuania | 99.7 /100 | #68 | Exceptional 1.7% |
| Chickasaw | 99.6 /100 | #69 | Exceptional 1.7% |
| Immigrants | Netherlands | 99.6 /100 | #70 | Exceptional 1.7% |
| Immigrants | England | 99.5 /100 | #71 | Exceptional 1.7% |
| Cajuns | 99.5 /100 | #72 | Exceptional 1.7% |
| Immigrants | India | 99.4 /100 | #73 | Exceptional 1.7% |
Demographics Similar to Immigrants from Laos by No Schooling Completed
In terms of no schooling completed, the demographic groups most similar to Immigrants from Laos are Immigrants from Bangladesh (3.1%, a difference of 0.11%), Immigrants from Burma/Myanmar (3.1%, a difference of 0.15%), Immigrants from Honduras (3.2%, a difference of 0.67%), Vietnamese (3.2%, a difference of 0.86%), and Immigrants from Guyana (3.1%, a difference of 0.89%).
| Demographics | Rating | Rank | No Schooling Completed |
| Immigrants | Belize | 0.0 /100 | #314 | Tragic 3.1% |
| Immigrants | Nicaragua | 0.0 /100 | #315 | Tragic 3.1% |
| Immigrants | Ecuador | 0.0 /100 | #316 | Tragic 3.1% |
| Cape Verdeans | 0.0 /100 | #317 | Tragic 3.1% |
| Immigrants | Guyana | 0.0 /100 | #318 | Tragic 3.1% |
| Immigrants | Burma/Myanmar | 0.0 /100 | #319 | Tragic 3.1% |
| Immigrants | Bangladesh | 0.0 /100 | #320 | Tragic 3.1% |
| Immigrants | Laos | 0.0 /100 | #321 | Tragic 3.1% |
| Immigrants | Honduras | 0.0 /100 | #322 | Tragic 3.2% |
| Vietnamese | 0.0 /100 | #323 | Tragic 3.2% |
| Mexican American Indians | 0.0 /100 | #324 | Tragic 3.2% |
| Dominicans | 0.0 /100 | #325 | Tragic 3.2% |
| Indonesians | 0.0 /100 | #326 | Tragic 3.2% |
| Immigrants | Latin America | 0.0 /100 | #327 | Tragic 3.3% |
| Mexicans | 0.0 /100 | #328 | Tragic 3.3% |