Canadian vs Immigrants from Jamaica Vision Disability
COMPARE
Canadian
Immigrants from Jamaica
Vision Disability
Vision Disability Comparison
Canadians
Immigrants from Jamaica
2.2%
VISION DISABILITY
25.8/ 100
METRIC RATING
191st/ 347
METRIC RANK
2.4%
VISION DISABILITY
0.1/ 100
METRIC RATING
265th/ 347
METRIC RANK
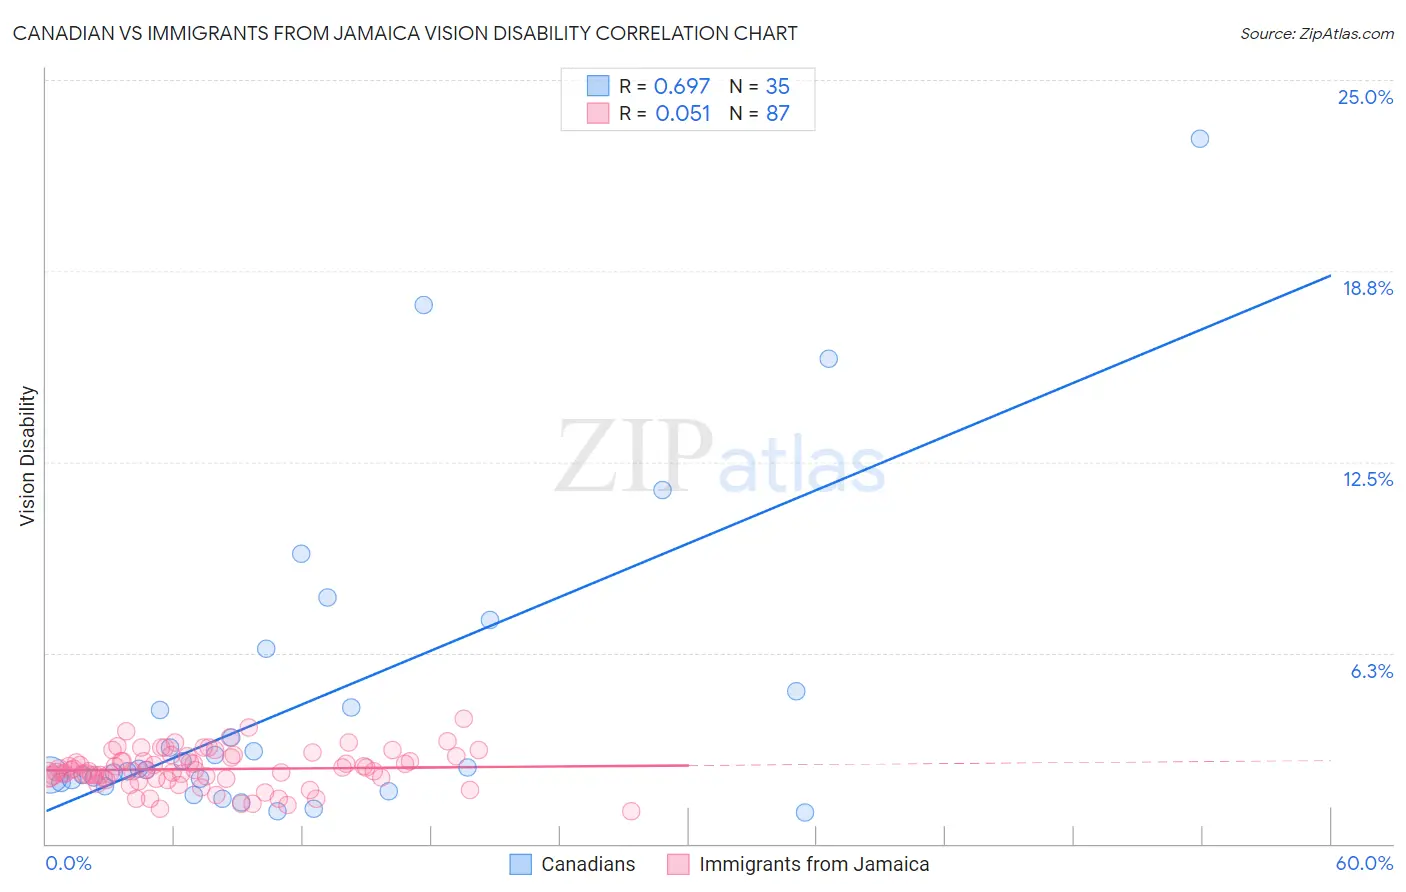
Canadian vs Immigrants from Jamaica Vision Disability Correlation Chart
The statistical analysis conducted on geographies consisting of 437,069,200 people shows a significant positive correlation between the proportion of Canadians and percentage of population with vision disability in the United States with a correlation coefficient (R) of 0.697 and weighted average of 2.2%. Similarly, the statistical analysis conducted on geographies consisting of 301,593,717 people shows a slight positive correlation between the proportion of Immigrants from Jamaica and percentage of population with vision disability in the United States with a correlation coefficient (R) of 0.051 and weighted average of 2.4%, a difference of 8.9%.
Vision Disability Correlation Summary
| Measurement | Canadian | Immigrants from Jamaica |
| Minimum | 1.0% | 1.1% |
| Maximum | 23.1% | 4.1% |
| Range | 22.0% | 3.0% |
| Mean | 4.7% | 2.4% |
| Median | 2.4% | 2.4% |
| Interquartile 25% (IQ1) | 2.0% | 2.1% |
| Interquartile 75% (IQ3) | 5.0% | 2.9% |
| Interquartile Range (IQR) | 3.0% | 0.75% |
| Standard Deviation (Sample) | 5.1% | 0.61% |
| Standard Deviation (Population) | 5.0% | 0.61% |
Similar Demographics by Vision Disability
Demographics Similar to Canadians by Vision Disability
In terms of vision disability, the demographic groups most similar to Canadians are European (2.2%, a difference of 0.010%), Immigrants from Costa Rica (2.2%, a difference of 0.020%), British (2.2%, a difference of 0.060%), Salvadoran (2.2%, a difference of 0.13%), and Immigrants from Barbados (2.2%, a difference of 0.15%).
| Demographics | Rating | Rank | Vision Disability |
| Moroccans | 35.4 /100 | #184 | Fair 2.2% |
| Immigrants | Middle Africa | 33.5 /100 | #185 | Fair 2.2% |
| Native Hawaiians | 33.3 /100 | #186 | Fair 2.2% |
| Immigrants | St. Vincent and the Grenadines | 30.3 /100 | #187 | Fair 2.2% |
| Guyanese | 28.9 /100 | #188 | Fair 2.2% |
| Salvadorans | 27.4 /100 | #189 | Fair 2.2% |
| Immigrants | Costa Rica | 26.1 /100 | #190 | Fair 2.2% |
| Canadians | 25.8 /100 | #191 | Fair 2.2% |
| Europeans | 25.7 /100 | #192 | Fair 2.2% |
| British | 25.1 /100 | #193 | Fair 2.2% |
| Immigrants | Barbados | 24.0 /100 | #194 | Fair 2.2% |
| Immigrants | Immigrants | 23.7 /100 | #195 | Fair 2.2% |
| Immigrants | Grenada | 23.1 /100 | #196 | Fair 2.2% |
| Ghanaians | 21.8 /100 | #197 | Fair 2.2% |
| Czechoslovakians | 21.6 /100 | #198 | Fair 2.2% |
Demographics Similar to Immigrants from Jamaica by Vision Disability
In terms of vision disability, the demographic groups most similar to Immigrants from Jamaica are Immigrants from Liberia (2.4%, a difference of 0.020%), Mexican American Indian (2.4%, a difference of 0.040%), Ute (2.4%, a difference of 0.050%), Immigrants from Belize (2.4%, a difference of 0.14%), and Senegalese (2.4%, a difference of 0.14%).
| Demographics | Rating | Rank | Vision Disability |
| British West Indians | 0.2 /100 | #258 | Tragic 2.4% |
| Whites/Caucasians | 0.2 /100 | #259 | Tragic 2.4% |
| Belizeans | 0.2 /100 | #260 | Tragic 2.4% |
| Fijians | 0.1 /100 | #261 | Tragic 2.4% |
| Jamaicans | 0.1 /100 | #262 | Tragic 2.4% |
| Immigrants | Belize | 0.1 /100 | #263 | Tragic 2.4% |
| Immigrants | Liberia | 0.1 /100 | #264 | Tragic 2.4% |
| Immigrants | Jamaica | 0.1 /100 | #265 | Tragic 2.4% |
| Mexican American Indians | 0.1 /100 | #266 | Tragic 2.4% |
| Ute | 0.1 /100 | #267 | Tragic 2.4% |
| Senegalese | 0.1 /100 | #268 | Tragic 2.4% |
| Celtics | 0.1 /100 | #269 | Tragic 2.4% |
| Cubans | 0.1 /100 | #270 | Tragic 2.4% |
| Immigrants | Azores | 0.1 /100 | #271 | Tragic 2.4% |
| Spaniards | 0.1 /100 | #272 | Tragic 2.4% |