Canadian vs Immigrants from Belgium 11th Grade
COMPARE
Canadian
Immigrants from Belgium
11th Grade
11th Grade Comparison
Canadians
Immigrants from Belgium
93.7%
11TH GRADE
99.5/ 100
METRIC RATING
80th/ 347
METRIC RANK
94.0%
11TH GRADE
99.8/ 100
METRIC RATING
61st/ 347
METRIC RANK
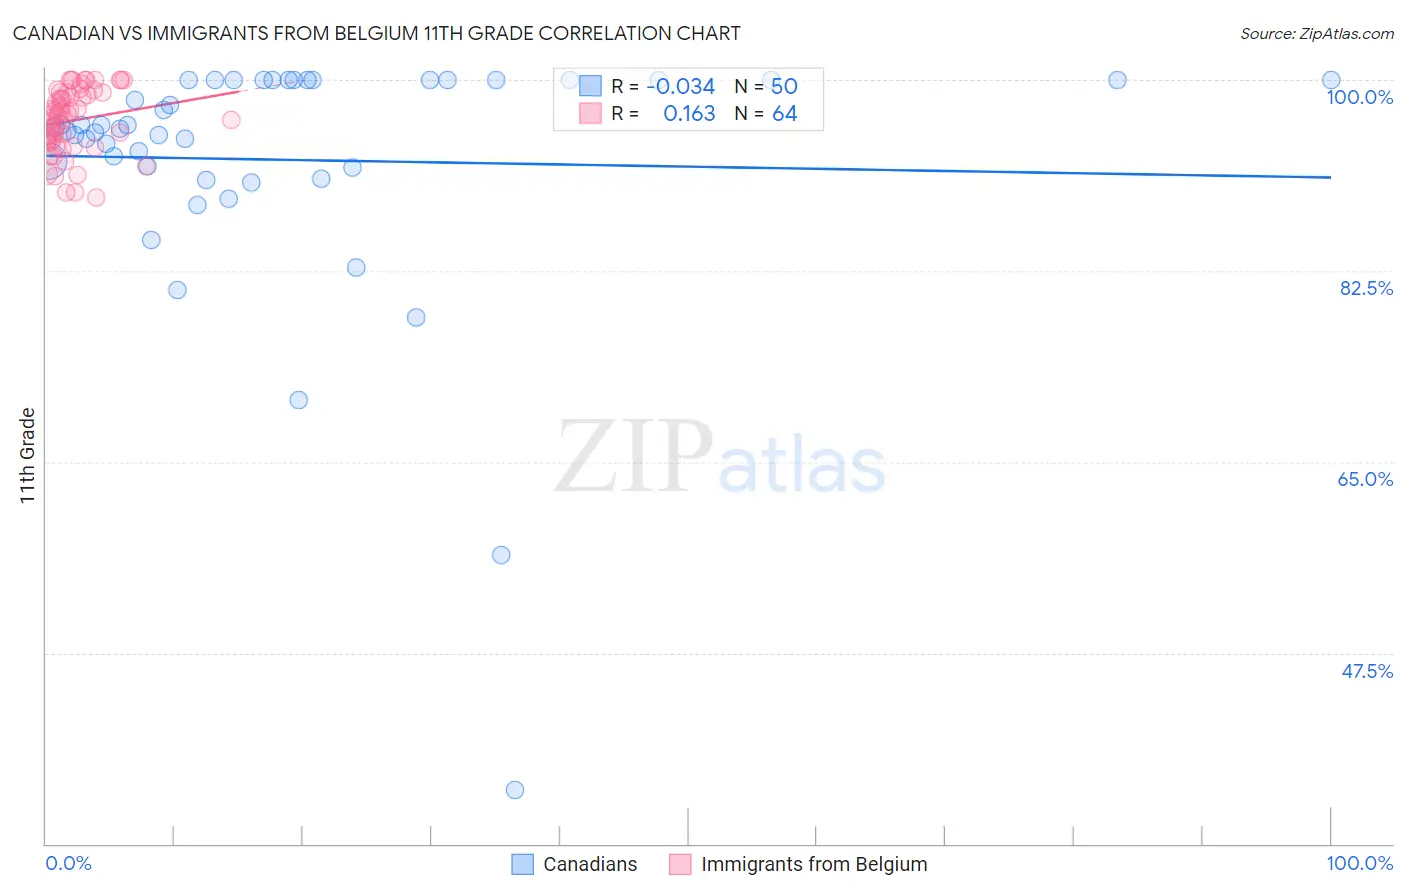
Canadian vs Immigrants from Belgium 11th Grade Correlation Chart
The statistical analysis conducted on geographies consisting of 437,556,598 people shows no correlation between the proportion of Canadians and percentage of population with at least 11th grade education in the United States with a correlation coefficient (R) of -0.034 and weighted average of 93.7%. Similarly, the statistical analysis conducted on geographies consisting of 146,727,159 people shows a poor positive correlation between the proportion of Immigrants from Belgium and percentage of population with at least 11th grade education in the United States with a correlation coefficient (R) of 0.163 and weighted average of 94.0%, a difference of 0.29%.
11th Grade Correlation Summary
| Measurement | Canadian | Immigrants from Belgium |
| Minimum | 34.9% | 89.3% |
| Maximum | 100.0% | 100.0% |
| Range | 65.1% | 10.7% |
| Mean | 92.7% | 96.3% |
| Median | 95.6% | 96.8% |
| Interquartile 25% (IQ1) | 92.0% | 94.5% |
| Interquartile 75% (IQ3) | 100.0% | 98.7% |
| Interquartile Range (IQR) | 8.0% | 4.3% |
| Standard Deviation (Sample) | 11.7% | 2.9% |
| Standard Deviation (Population) | 11.6% | 2.9% |
Demographics Similar to Canadians and Immigrants from Belgium by 11th Grade
In terms of 11th grade, the demographic groups most similar to Canadians are Immigrants from Denmark (93.7%, a difference of 0.020%), Celtic (93.7%, a difference of 0.030%), Aleut (93.7%, a difference of 0.030%), Soviet Union (93.7%, a difference of 0.030%), and Immigrants from Latvia (93.8%, a difference of 0.060%). Similarly, the demographic groups most similar to Immigrants from Belgium are Austrian (94.0%, a difference of 0.0%), Okinawan (94.0%, a difference of 0.010%), Ukrainian (94.0%, a difference of 0.030%), Immigrants from Sweden (93.9%, a difference of 0.050%), and Native Hawaiian (93.9%, a difference of 0.060%).
| Demographics | Rating | Rank | 11th Grade |
| Okinawans | 99.8 /100 | #60 | Exceptional 94.0% |
| Immigrants | Belgium | 99.8 /100 | #61 | Exceptional 94.0% |
| Austrians | 99.8 /100 | #62 | Exceptional 94.0% |
| Ukrainians | 99.8 /100 | #63 | Exceptional 94.0% |
| Immigrants | Sweden | 99.8 /100 | #64 | Exceptional 93.9% |
| Native Hawaiians | 99.8 /100 | #65 | Exceptional 93.9% |
| Alaskan Athabascans | 99.8 /100 | #66 | Exceptional 93.9% |
| Immigrants | Netherlands | 99.8 /100 | #67 | Exceptional 93.9% |
| Zimbabweans | 99.8 /100 | #68 | Exceptional 93.9% |
| Scotch-Irish | 99.8 /100 | #69 | Exceptional 93.9% |
| Immigrants | England | 99.7 /100 | #70 | Exceptional 93.8% |
| Immigrants | South Africa | 99.7 /100 | #71 | Exceptional 93.8% |
| Immigrants | Japan | 99.7 /100 | #72 | Exceptional 93.8% |
| Romanians | 99.6 /100 | #73 | Exceptional 93.8% |
| Immigrants | Czechoslovakia | 99.6 /100 | #74 | Exceptional 93.8% |
| Immigrants | Latvia | 99.6 /100 | #75 | Exceptional 93.8% |
| Celtics | 99.5 /100 | #76 | Exceptional 93.7% |
| Aleuts | 99.5 /100 | #77 | Exceptional 93.7% |
| Soviet Union | 99.5 /100 | #78 | Exceptional 93.7% |
| Immigrants | Denmark | 99.5 /100 | #79 | Exceptional 93.7% |
| Canadians | 99.5 /100 | #80 | Exceptional 93.7% |