Cajun vs Somali Unemployment Among Ages 30 to 34 years
COMPARE
Cajun
Somali
Unemployment Among Ages 30 to 34 years
Unemployment Among Ages 30 to 34 years Comparison
Cajuns
Somalis
6.7%
UNEMPLOYMENT AMONG AGES 30 TO 34 YEARS
0.0/ 100
METRIC RATING
303rd/ 347
METRIC RANK
5.0%
UNEMPLOYMENT AMONG AGES 30 TO 34 YEARS
99.3/ 100
METRIC RATING
31st/ 347
METRIC RANK
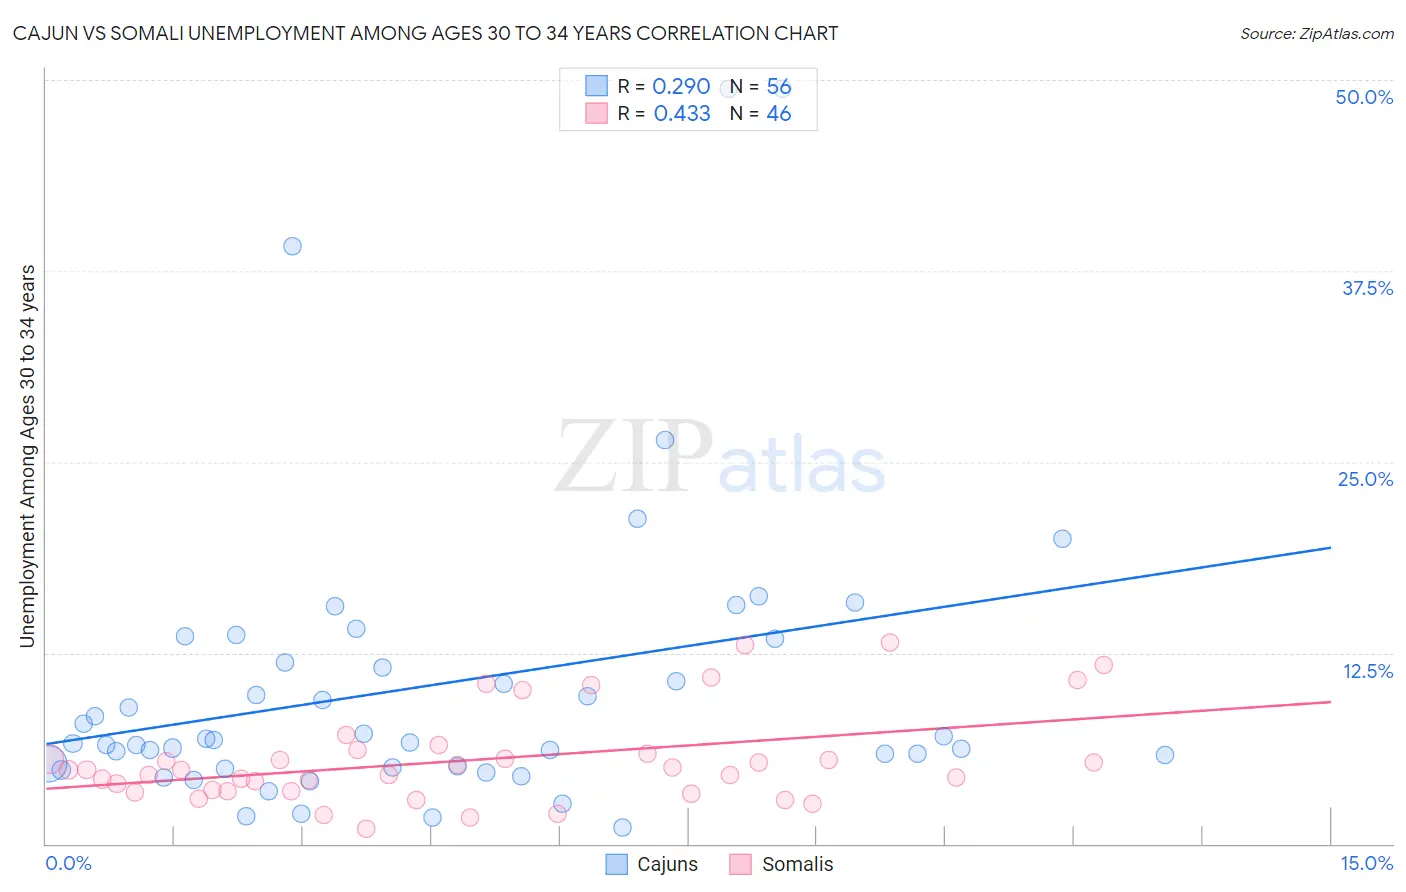
Cajun vs Somali Unemployment Among Ages 30 to 34 years Correlation Chart
The statistical analysis conducted on geographies consisting of 144,402,531 people shows a weak positive correlation between the proportion of Cajuns and unemployment rate among population between the ages 30 and 34 in the United States with a correlation coefficient (R) of 0.290 and weighted average of 6.7%. Similarly, the statistical analysis conducted on geographies consisting of 97,950,749 people shows a moderate positive correlation between the proportion of Somalis and unemployment rate among population between the ages 30 and 34 in the United States with a correlation coefficient (R) of 0.433 and weighted average of 5.0%, a difference of 33.7%.
Unemployment Among Ages 30 to 34 years Correlation Summary
| Measurement | Cajun | Somali |
| Minimum | 1.1% | 1.0% |
| Maximum | 49.4% | 13.2% |
| Range | 48.3% | 12.2% |
| Mean | 10.4% | 5.5% |
| Median | 6.7% | 4.8% |
| Interquartile 25% (IQ1) | 5.0% | 3.4% |
| Interquartile 75% (IQ3) | 12.6% | 5.9% |
| Interquartile Range (IQR) | 7.6% | 2.4% |
| Standard Deviation (Sample) | 10.0% | 3.0% |
| Standard Deviation (Population) | 9.9% | 3.0% |
Similar Demographics by Unemployment Among Ages 30 to 34 years
Demographics Similar to Cajuns by Unemployment Among Ages 30 to 34 years
In terms of unemployment among ages 30 to 34 years, the demographic groups most similar to Cajuns are Delaware (6.7%, a difference of 0.19%), Kiowa (6.7%, a difference of 0.42%), Paiute (6.7%, a difference of 0.46%), Belizean (6.6%, a difference of 1.0%), and Bahamian (6.6%, a difference of 1.3%).
| Demographics | Rating | Rank | Unemployment Among Ages 30 to 34 years |
| Immigrants | Jamaica | 0.0 /100 | #296 | Tragic 6.5% |
| Creek | 0.0 /100 | #297 | Tragic 6.6% |
| Immigrants | Barbados | 0.0 /100 | #298 | Tragic 6.6% |
| Dutch West Indians | 0.0 /100 | #299 | Tragic 6.6% |
| Bahamians | 0.0 /100 | #300 | Tragic 6.6% |
| Belizeans | 0.0 /100 | #301 | Tragic 6.6% |
| Delaware | 0.0 /100 | #302 | Tragic 6.7% |
| Cajuns | 0.0 /100 | #303 | Tragic 6.7% |
| Kiowa | 0.0 /100 | #304 | Tragic 6.7% |
| Paiute | 0.0 /100 | #305 | Tragic 6.7% |
| Immigrants | Armenia | 0.0 /100 | #306 | Tragic 6.8% |
| Immigrants | Belize | 0.0 /100 | #307 | Tragic 6.9% |
| Immigrants | Azores | 0.0 /100 | #308 | Tragic 6.9% |
| Immigrants | Grenada | 0.0 /100 | #309 | Tragic 6.9% |
| Immigrants | St. Vincent and the Grenadines | 0.0 /100 | #310 | Tragic 7.0% |
Demographics Similar to Somalis by Unemployment Among Ages 30 to 34 years
In terms of unemployment among ages 30 to 34 years, the demographic groups most similar to Somalis are Immigrants from Zaire (5.0%, a difference of 0.040%), Norwegian (5.0%, a difference of 0.090%), German Russian (5.0%, a difference of 0.11%), Immigrants from Cuba (5.0%, a difference of 0.13%), and Immigrants from Saudi Arabia (5.0%, a difference of 0.14%).
| Demographics | Rating | Rank | Unemployment Among Ages 30 to 34 years |
| Ugandans | 99.7 /100 | #24 | Exceptional 4.9% |
| Immigrants | Singapore | 99.5 /100 | #25 | Exceptional 5.0% |
| Immigrants | Kuwait | 99.5 /100 | #26 | Exceptional 5.0% |
| Danes | 99.5 /100 | #27 | Exceptional 5.0% |
| Immigrants | Cuba | 99.4 /100 | #28 | Exceptional 5.0% |
| German Russians | 99.4 /100 | #29 | Exceptional 5.0% |
| Norwegians | 99.4 /100 | #30 | Exceptional 5.0% |
| Somalis | 99.3 /100 | #31 | Exceptional 5.0% |
| Immigrants | Zaire | 99.3 /100 | #32 | Exceptional 5.0% |
| Immigrants | Saudi Arabia | 99.3 /100 | #33 | Exceptional 5.0% |
| Latvians | 99.3 /100 | #34 | Exceptional 5.0% |
| Immigrants | Ethiopia | 99.2 /100 | #35 | Exceptional 5.0% |
| Czechs | 99.2 /100 | #36 | Exceptional 5.0% |
| Immigrants | Turkey | 99.0 /100 | #37 | Exceptional 5.0% |
| Sri Lankans | 99.0 /100 | #38 | Exceptional 5.0% |