Cajun vs Immigrants from Nicaragua 8th Grade
COMPARE
Cajun
Immigrants from Nicaragua
8th Grade
8th Grade Comparison
Cajuns
Immigrants from Nicaragua
96.3%
8TH GRADE
97.1/ 100
METRIC RATING
110th/ 347
METRIC RANK
92.5%
8TH GRADE
0.0/ 100
METRIC RATING
328th/ 347
METRIC RANK
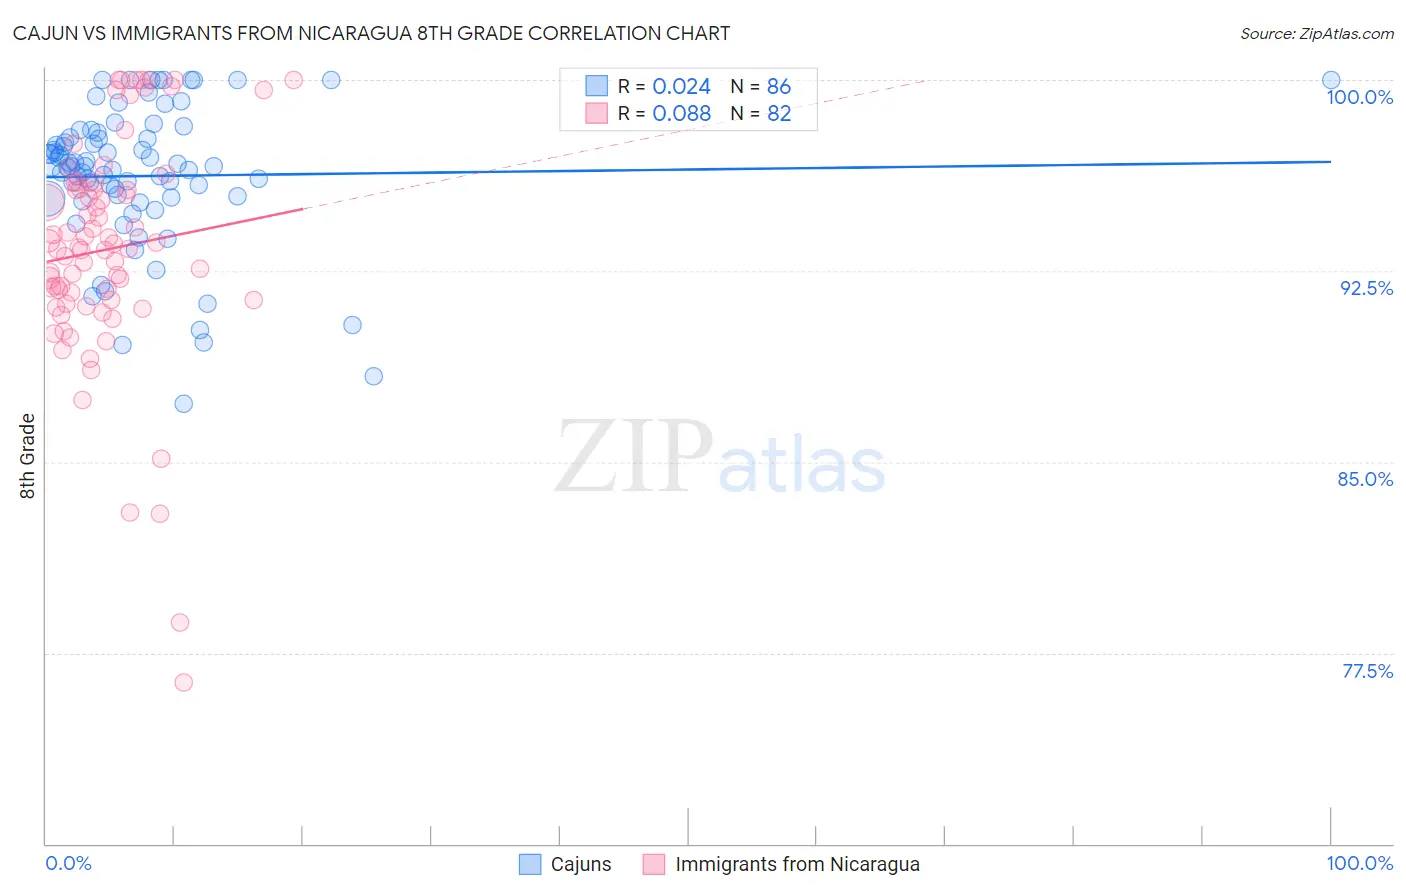
Cajun vs Immigrants from Nicaragua 8th Grade Correlation Chart
The statistical analysis conducted on geographies consisting of 149,712,957 people shows no correlation between the proportion of Cajuns and percentage of population with at least 8th grade education in the United States with a correlation coefficient (R) of 0.024 and weighted average of 96.3%. Similarly, the statistical analysis conducted on geographies consisting of 236,340,506 people shows a slight positive correlation between the proportion of Immigrants from Nicaragua and percentage of population with at least 8th grade education in the United States with a correlation coefficient (R) of 0.088 and weighted average of 92.5%, a difference of 4.1%.
8th Grade Correlation Summary
| Measurement | Cajun | Immigrants from Nicaragua |
| Minimum | 87.3% | 76.3% |
| Maximum | 100.0% | 100.0% |
| Range | 12.7% | 23.7% |
| Mean | 96.2% | 93.4% |
| Median | 96.6% | 93.4% |
| Interquartile 25% (IQ1) | 95.4% | 91.4% |
| Interquartile 75% (IQ3) | 97.7% | 95.7% |
| Interquartile Range (IQR) | 2.4% | 4.3% |
| Standard Deviation (Sample) | 2.8% | 4.5% |
| Standard Deviation (Population) | 2.8% | 4.5% |
Similar Demographics by 8th Grade
Demographics Similar to Cajuns by 8th Grade
In terms of 8th grade, the demographic groups most similar to Cajuns are Iroquois (96.3%, a difference of 0.020%), Shoshone (96.3%, a difference of 0.020%), Syrian (96.3%, a difference of 0.020%), Lebanese (96.3%, a difference of 0.030%), and Immigrants from Zimbabwe (96.3%, a difference of 0.030%).
| Demographics | Rating | Rank | 8th Grade |
| Immigrants | Saudi Arabia | 98.0 /100 | #103 | Exceptional 96.3% |
| Kiowa | 98.0 /100 | #104 | Exceptional 96.3% |
| Immigrants | North Macedonia | 98.0 /100 | #105 | Exceptional 96.3% |
| Okinawans | 98.0 /100 | #106 | Exceptional 96.3% |
| Immigrants | Latvia | 97.8 /100 | #107 | Exceptional 96.3% |
| Lebanese | 97.5 /100 | #108 | Exceptional 96.3% |
| Iroquois | 97.5 /100 | #109 | Exceptional 96.3% |
| Cajuns | 97.1 /100 | #110 | Exceptional 96.3% |
| Shoshone | 96.8 /100 | #111 | Exceptional 96.3% |
| Syrians | 96.7 /100 | #112 | Exceptional 96.3% |
| Immigrants | Zimbabwe | 96.7 /100 | #113 | Exceptional 96.3% |
| Immigrants | Japan | 96.5 /100 | #114 | Exceptional 96.2% |
| Immigrants | Moldova | 96.5 /100 | #115 | Exceptional 96.2% |
| Immigrants | Nonimmigrants | 96.0 /100 | #116 | Exceptional 96.2% |
| Immigrants | Croatia | 96.0 /100 | #117 | Exceptional 96.2% |
Demographics Similar to Immigrants from Nicaragua by 8th Grade
In terms of 8th grade, the demographic groups most similar to Immigrants from Nicaragua are Immigrants from the Azores (92.5%, a difference of 0.030%), Immigrants from Cabo Verde (92.4%, a difference of 0.060%), Immigrants from Armenia (92.3%, a difference of 0.15%), Honduran (92.3%, a difference of 0.15%), and Immigrants from Dominican Republic (92.3%, a difference of 0.17%).
| Demographics | Rating | Rank | 8th Grade |
| Belizeans | 0.0 /100 | #321 | Tragic 93.1% |
| Nicaraguans | 0.0 /100 | #322 | Tragic 93.0% |
| Immigrants | Belize | 0.0 /100 | #323 | Tragic 92.9% |
| Nepalese | 0.0 /100 | #324 | Tragic 92.8% |
| Dominicans | 0.0 /100 | #325 | Tragic 92.8% |
| Central American Indians | 0.0 /100 | #326 | Tragic 92.7% |
| Immigrants | Azores | 0.0 /100 | #327 | Tragic 92.5% |
| Immigrants | Nicaragua | 0.0 /100 | #328 | Tragic 92.5% |
| Immigrants | Cabo Verde | 0.0 /100 | #329 | Tragic 92.4% |
| Immigrants | Armenia | 0.0 /100 | #330 | Tragic 92.3% |
| Hondurans | 0.0 /100 | #331 | Tragic 92.3% |
| Immigrants | Dominican Republic | 0.0 /100 | #332 | Tragic 92.3% |
| Hispanics or Latinos | 0.0 /100 | #333 | Tragic 92.2% |
| Immigrants | Yemen | 0.0 /100 | #334 | Tragic 92.1% |
| Mexican American Indians | 0.0 /100 | #335 | Tragic 92.1% |