Cajun vs Immigrants from Thailand 8th Grade
COMPARE
Cajun
Immigrants from Thailand
8th Grade
8th Grade Comparison
Cajuns
Immigrants from Thailand
96.3%
8TH GRADE
97.1/ 100
METRIC RATING
110th/ 347
METRIC RANK
94.8%
8TH GRADE
0.2/ 100
METRIC RATING
269th/ 347
METRIC RANK
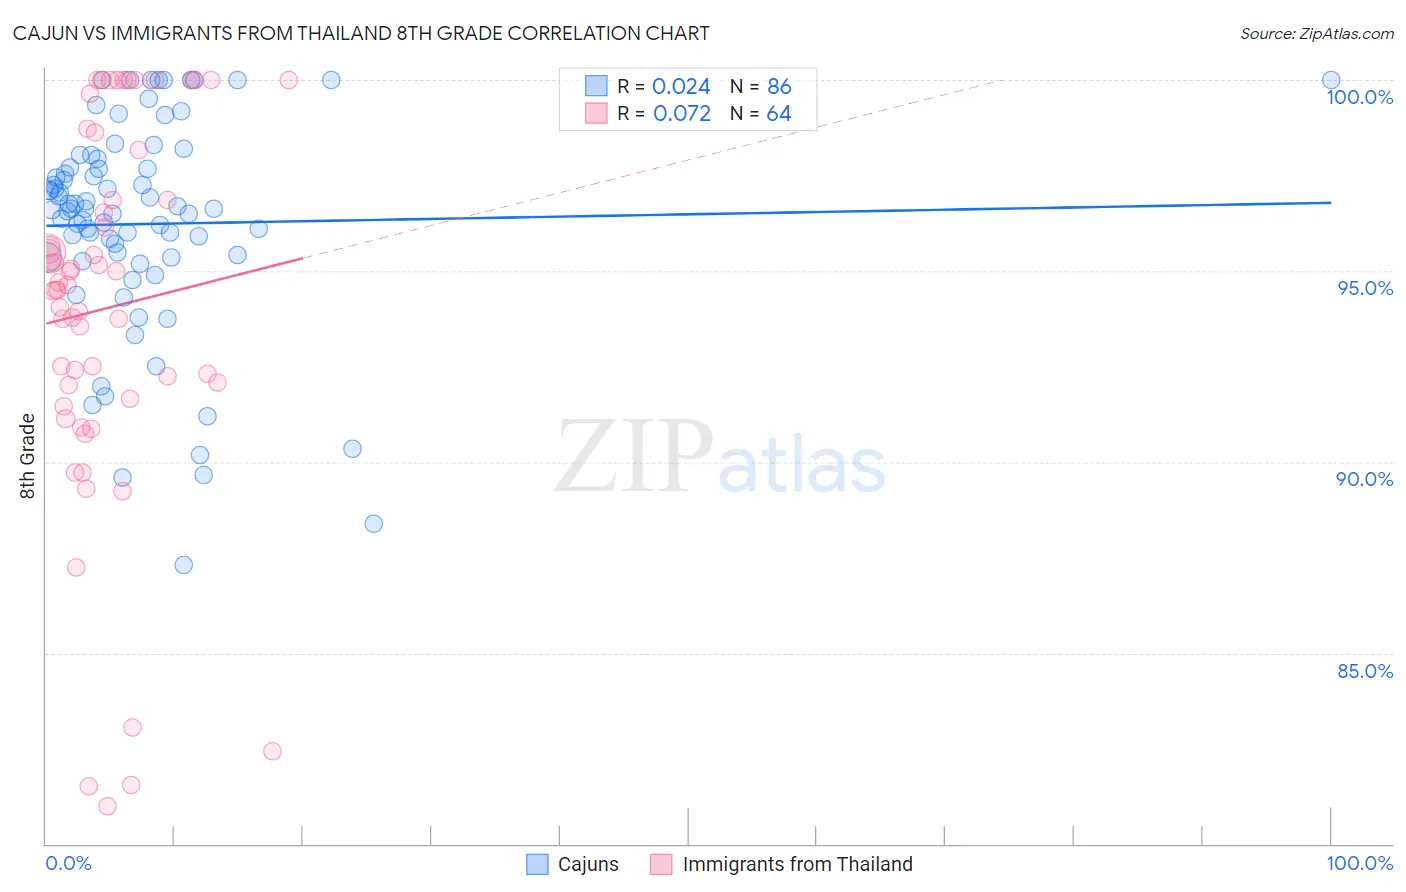
Cajun vs Immigrants from Thailand 8th Grade Correlation Chart
The statistical analysis conducted on geographies consisting of 149,712,957 people shows no correlation between the proportion of Cajuns and percentage of population with at least 8th grade education in the United States with a correlation coefficient (R) of 0.024 and weighted average of 96.3%. Similarly, the statistical analysis conducted on geographies consisting of 317,022,868 people shows a slight positive correlation between the proportion of Immigrants from Thailand and percentage of population with at least 8th grade education in the United States with a correlation coefficient (R) of 0.072 and weighted average of 94.8%, a difference of 1.6%.
8th Grade Correlation Summary
| Measurement | Cajun | Immigrants from Thailand |
| Minimum | 87.3% | 81.0% |
| Maximum | 100.0% | 100.0% |
| Range | 12.7% | 19.0% |
| Mean | 96.2% | 94.0% |
| Median | 96.6% | 94.6% |
| Interquartile 25% (IQ1) | 95.4% | 91.8% |
| Interquartile 75% (IQ3) | 97.7% | 97.5% |
| Interquartile Range (IQR) | 2.4% | 5.7% |
| Standard Deviation (Sample) | 2.8% | 4.9% |
| Standard Deviation (Population) | 2.8% | 4.8% |
Similar Demographics by 8th Grade
Demographics Similar to Cajuns by 8th Grade
In terms of 8th grade, the demographic groups most similar to Cajuns are Iroquois (96.3%, a difference of 0.020%), Shoshone (96.3%, a difference of 0.020%), Syrian (96.3%, a difference of 0.020%), Lebanese (96.3%, a difference of 0.030%), and Immigrants from Zimbabwe (96.3%, a difference of 0.030%).
| Demographics | Rating | Rank | 8th Grade |
| Immigrants | Saudi Arabia | 98.0 /100 | #103 | Exceptional 96.3% |
| Kiowa | 98.0 /100 | #104 | Exceptional 96.3% |
| Immigrants | North Macedonia | 98.0 /100 | #105 | Exceptional 96.3% |
| Okinawans | 98.0 /100 | #106 | Exceptional 96.3% |
| Immigrants | Latvia | 97.8 /100 | #107 | Exceptional 96.3% |
| Lebanese | 97.5 /100 | #108 | Exceptional 96.3% |
| Iroquois | 97.5 /100 | #109 | Exceptional 96.3% |
| Cajuns | 97.1 /100 | #110 | Exceptional 96.3% |
| Shoshone | 96.8 /100 | #111 | Exceptional 96.3% |
| Syrians | 96.7 /100 | #112 | Exceptional 96.3% |
| Immigrants | Zimbabwe | 96.7 /100 | #113 | Exceptional 96.3% |
| Immigrants | Japan | 96.5 /100 | #114 | Exceptional 96.2% |
| Immigrants | Moldova | 96.5 /100 | #115 | Exceptional 96.2% |
| Immigrants | Nonimmigrants | 96.0 /100 | #116 | Exceptional 96.2% |
| Immigrants | Croatia | 96.0 /100 | #117 | Exceptional 96.2% |
Demographics Similar to Immigrants from Thailand by 8th Grade
In terms of 8th grade, the demographic groups most similar to Immigrants from Thailand are Immigrants from Ghana (94.8%, a difference of 0.020%), Immigrants from Uruguay (94.8%, a difference of 0.020%), Immigrants from Uzbekistan (94.8%, a difference of 0.020%), Immigrants from Afghanistan (94.8%, a difference of 0.020%), and West Indian (94.8%, a difference of 0.040%).
| Demographics | Rating | Rank | 8th Grade |
| Immigrants | Nigeria | 0.4 /100 | #262 | Tragic 94.9% |
| Immigrants | Hong Kong | 0.4 /100 | #263 | Tragic 94.9% |
| South Americans | 0.4 /100 | #264 | Tragic 94.9% |
| Yuman | 0.4 /100 | #265 | Tragic 94.9% |
| West Indians | 0.3 /100 | #266 | Tragic 94.8% |
| Immigrants | Ghana | 0.3 /100 | #267 | Tragic 94.8% |
| Immigrants | Uruguay | 0.3 /100 | #268 | Tragic 94.8% |
| Immigrants | Thailand | 0.2 /100 | #269 | Tragic 94.8% |
| Immigrants | Uzbekistan | 0.2 /100 | #270 | Tragic 94.8% |
| Immigrants | Afghanistan | 0.2 /100 | #271 | Tragic 94.8% |
| Immigrants | South America | 0.2 /100 | #272 | Tragic 94.8% |
| Immigrants | Western Africa | 0.2 /100 | #273 | Tragic 94.8% |
| Trinidadians and Tobagonians | 0.2 /100 | #274 | Tragic 94.7% |
| Immigrants | Colombia | 0.2 /100 | #275 | Tragic 94.7% |
| Peruvians | 0.1 /100 | #276 | Tragic 94.7% |