Cajun vs Bermudan Unemployment Among Youth under 25 years
COMPARE
Cajun
Bermudan
Unemployment Among Youth under 25 years
Unemployment Among Youth under 25 years Comparison
Cajuns
Bermudans
13.2%
UNEMPLOYMENT AMONG YOUTH UNDER 25 YEARS
0.0/ 100
METRIC RATING
279th/ 347
METRIC RANK
13.0%
UNEMPLOYMENT AMONG YOUTH UNDER 25 YEARS
0.0/ 100
METRIC RATING
275th/ 347
METRIC RANK
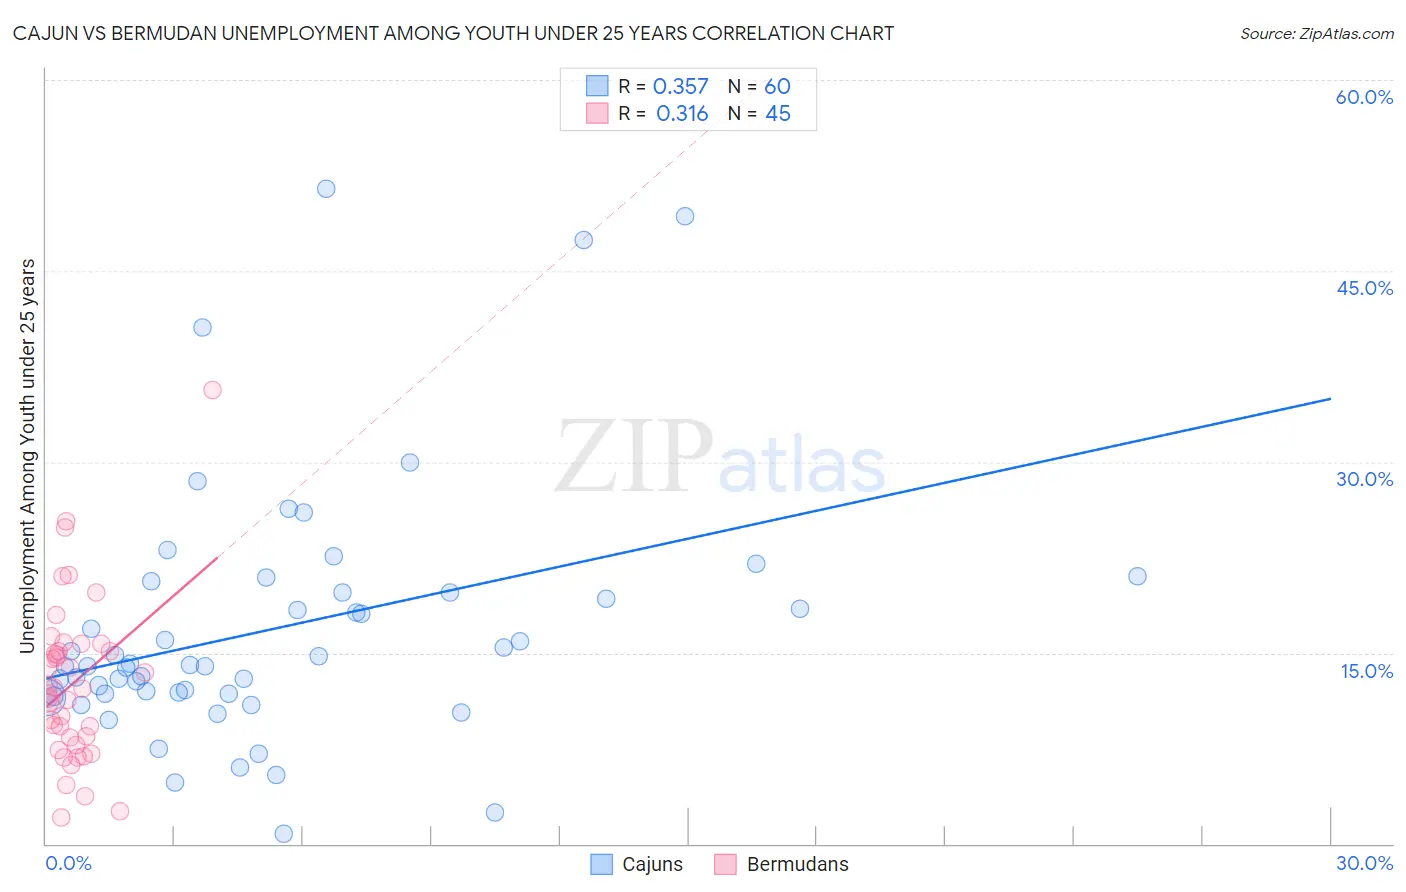
Cajun vs Bermudan Unemployment Among Youth under 25 years Correlation Chart
The statistical analysis conducted on geographies consisting of 148,147,814 people shows a mild positive correlation between the proportion of Cajuns and unemployment rate among youth under the age of 25 in the United States with a correlation coefficient (R) of 0.357 and weighted average of 13.2%. Similarly, the statistical analysis conducted on geographies consisting of 55,599,770 people shows a mild positive correlation between the proportion of Bermudans and unemployment rate among youth under the age of 25 in the United States with a correlation coefficient (R) of 0.316 and weighted average of 13.0%, a difference of 1.5%.
Unemployment Among Youth under 25 years Correlation Summary
| Measurement | Cajun | Bermudan |
| Minimum | 0.80% | 2.1% |
| Maximum | 51.5% | 35.6% |
| Range | 50.7% | 33.5% |
| Mean | 16.9% | 12.6% |
| Median | 14.0% | 12.2% |
| Interquartile 25% (IQ1) | 11.8% | 8.1% |
| Interquartile 75% (IQ3) | 19.8% | 15.4% |
| Interquartile Range (IQR) | 8.0% | 7.3% |
| Standard Deviation (Sample) | 10.1% | 6.4% |
| Standard Deviation (Population) | 10.0% | 6.3% |
Demographics Similar to Cajuns and Bermudans by Unemployment Among Youth under 25 years
In terms of unemployment among youth under 25 years, the demographic groups most similar to Cajuns are Ute (13.3%, a difference of 0.25%), Armenian (13.3%, a difference of 0.28%), Sierra Leonean (13.3%, a difference of 0.29%), Immigrants from Cameroon (13.3%, a difference of 0.32%), and Lumbee (13.3%, a difference of 0.33%). Similarly, the demographic groups most similar to Bermudans are Immigrants from Nigeria (13.0%, a difference of 0.11%), Immigrants from Uzbekistan (13.1%, a difference of 0.43%), Bahamian (13.1%, a difference of 0.60%), Nigerian (13.0%, a difference of 0.69%), and African (13.2%, a difference of 0.85%).
| Demographics | Rating | Rank | Unemployment Among Youth under 25 years |
| Sub-Saharan Africans | 0.0 /100 | #267 | Tragic 12.6% |
| Tlingit-Haida | 0.0 /100 | #268 | Tragic 12.7% |
| Kiowa | 0.0 /100 | #269 | Tragic 12.7% |
| Immigrants | Liberia | 0.0 /100 | #270 | Tragic 12.8% |
| Immigrants | Bahamas | 0.0 /100 | #271 | Tragic 12.9% |
| Cape Verdeans | 0.0 /100 | #272 | Tragic 12.9% |
| Nigerians | 0.0 /100 | #273 | Tragic 13.0% |
| Immigrants | Nigeria | 0.0 /100 | #274 | Tragic 13.0% |
| Bermudans | 0.0 /100 | #275 | Tragic 13.0% |
| Immigrants | Uzbekistan | 0.0 /100 | #276 | Tragic 13.1% |
| Bahamians | 0.0 /100 | #277 | Tragic 13.1% |
| Africans | 0.0 /100 | #278 | Tragic 13.2% |
| Cajuns | 0.0 /100 | #279 | Tragic 13.2% |
| Ute | 0.0 /100 | #280 | Tragic 13.3% |
| Armenians | 0.0 /100 | #281 | Tragic 13.3% |
| Sierra Leoneans | 0.0 /100 | #282 | Tragic 13.3% |
| Immigrants | Cameroon | 0.0 /100 | #283 | Tragic 13.3% |
| Lumbee | 0.0 /100 | #284 | Tragic 13.3% |
| Ghanaians | 0.0 /100 | #285 | Tragic 13.3% |
| Blackfeet | 0.0 /100 | #286 | Tragic 13.3% |
| Ecuadorians | 0.0 /100 | #287 | Tragic 13.3% |