Burmese vs Houma 10th Grade

COMPARE

Burmese
Race
Ancestry
AfghanAfricanAlaska NativeAlaskan AthabascanAlbanianAleutAlsatianAmericanApacheArabArapahoArgentineanArmenianAssyrian/Chaldean/SyriacAustralianAustrianBahamianBangladeshiBarbadianBasqueBelgianBelizeanBermudanBhutaneseBlackfeetBolivianBrazilianBritishBritish West IndianBulgarianBurmeseCajunCambodianCanadianCape VerdeanCarpatho RusynCelticCentral AmericanCentral American IndianCherokeeCheyenneChickasawChileanChineseChippewaChoctawColombianColvilleComancheCosta RicanCreeCreekCroatianCrowCubanCypriotCzechCzechoslovakianDanishDelawareDominicanDutchDutch West IndianEastern EuropeanEcuadorianEgyptianEnglishEstonianEthiopianEuropeanFijianFilipinoFinnishFrenchFrench American IndianFrench CanadianGermanGerman RussianGhanaianGreekGuamanian/ChamorroGuatemalanGuyaneseHaitianHmongHonduranHopiHungarianIcelanderIndian (Asian)IndonesianInupiatIranianIraqiIrishIroquoisIsraeliItalianJamaicanJapaneseJordanianKenyanKiowaKoreanLaotianLatvianLebaneseLiberianLithuanianLumbeeLuxembourgerMacedonianMalaysianMalteseMarshalleseMenomineeMexicanMexican American IndianMongolianMoroccanNative HawaiianNavajoNepaleseNew ZealanderNicaraguanNigerianNorthern EuropeanNorwegianOkinawanOsageOttawaPaiutePakistaniPalestinianPanamanianParaguayanPennsylvania GermanPeruvianPimaPolishPortuguesePotawatomiPuebloPuerto RicanPuget Sound SalishRomanianRussianSalvadoranSamoanScandinavianScotch-IrishScottishSeminoleSenegaleseSerbianShoshoneSierra LeoneanSiouxSlavicSlovakSloveneSomaliSouth AfricanSouth AmericanSouth American IndianSoviet UnionSpaniardSpanishSpanish AmericanSpanish American IndianSri LankanSubsaharan AfricanSudaneseSwedishSwissSyrianTaiwaneseThaiTlingit-HaidaTohono O'OdhamTonganTrinidadian and TobagonianTsimshianTurkishU.S. Virgin IslanderUgandanUkrainianUruguayanUteVenezuelanVietnameseWelshWest IndianYakamaYaquiYugoslavianYumanYup'ikZimbabwean
Immigration
NonimmigrantsImmigrantsAfghanistanAfricaAlbaniaArgentinaArmeniaAsiaAustraliaAustriaBahamasBangladeshBarbadosBelarusBelgiumBelizeBoliviaBosnia and HerzegovinaBrazilBulgariaBurma/MyanmarCabo VerdeCambodiaCameroonCanadaCaribbeanCentral AmericaChileChinaColombiaCongoCosta RicaCroatiaCubaCzechoslovakiaDenmarkDominicaDominican RepublicEastern AfricaEastern AsiaEastern EuropeEcuadorEgyptEl SalvadorEnglandEritreaEthiopiaEuropeFijiFranceGermanyGhanaGreeceGrenadaGuatemalaGuyanaHaitiHondurasHong KongHungaryIndiaIndonesiaIranIraqIrelandIsraelItalyJamaicaJapanJordanKazakhstanKenyaKoreaKuwaitLaosLatin AmericaLatviaLebanonLiberiaLithuaniaMalaysiaMexicoMicronesiaMiddle AfricaMoldovaMoroccoNepalNetherlandsNicaraguaNigeriaNorth AmericaNorth MacedoniaNorthern AfricaNorthern EuropeNorwayOceaniaPakistanPanamaPeruPhilippinesPolandPortugalRomaniaRussiaSaudi ArabiaScotlandSenegalSerbiaSierra LeoneSingaporeSomaliaSouth AfricaSouth AmericaSouth Central AsiaSouth Eastern AsiaSouthern EuropeSpainSri LankaSt. Vincent and the GrenadinesSudanSwedenSwitzerlandSyriaTaiwanThailandTrinidad and TobagoTurkeyUgandaUkraineUruguayUzbekistanVenezuelaVietnamWest IndiesWestern AfricaWestern AsiaWestern EuropeYemenZaireZimbabweAzores
Houma
Race
Ancestry
AfghanAfricanAlaska NativeAlaskan AthabascanAlbanianAleutAlsatianAmericanApacheArabArapahoArgentineanArmenianAssyrian/Chaldean/SyriacAustralianAustrianBahamianBangladeshiBarbadianBasqueBelgianBelizeanBermudanBhutaneseBlackfeetBolivianBrazilianBritishBritish West IndianBulgarianCajunCambodianCanadianCape VerdeanCarpatho RusynCelticCentral AmericanCentral American IndianCherokeeCheyenneChickasawChileanChineseChippewaChoctawColombianColvilleComancheCosta RicanCreeCreekCroatianCrowCubanCypriotCzechCzechoslovakianDanishDelawareDominicanDutchDutch West IndianEastern EuropeanEcuadorianEgyptianEnglishEstonianEthiopianEuropeanFijianFilipinoFinnishFrenchFrench American IndianFrench CanadianGermanGerman RussianGhanaianGreekGuamanian/ChamorroGuatemalanGuyaneseHaitianHmongHonduranHopiHoumaHungarianIcelanderIndian (Asian)IndonesianInupiatIranianIraqiIrishIroquoisIsraeliItalianJamaicanJapaneseJordanianKenyanKiowaKoreanLaotianLatvianLebaneseLiberianLithuanianLumbeeLuxembourgerMacedonianMalaysianMalteseMarshalleseMenomineeMexicanMexican American IndianMongolianMoroccanNative HawaiianNavajoNepaleseNew ZealanderNicaraguanNigerianNorthern EuropeanNorwegianOkinawanOsageOttawaPaiutePakistaniPalestinianPanamanianParaguayanPennsylvania GermanPeruvianPimaPolishPortuguesePotawatomiPuebloPuerto RicanPuget Sound SalishRomanianRussianSalvadoranSamoanScandinavianScotch-IrishScottishSeminoleSenegaleseSerbianShoshoneSierra LeoneanSiouxSlavicSlovakSloveneSomaliSouth AfricanSouth AmericanSouth American IndianSoviet UnionSpaniardSpanishSpanish AmericanSpanish American IndianSri LankanSubsaharan AfricanSudaneseSwedishSwissSyrianTaiwaneseThaiTlingit-HaidaTohono O'OdhamTonganTrinidadian and TobagonianTsimshianTurkishU.S. Virgin IslanderUgandanUkrainianUruguayanUteVenezuelanVietnameseWelshWest IndianYakamaYaquiYugoslavianYumanYup'ikZimbabwean
Immigration
NonimmigrantsImmigrantsAfghanistanAfricaAlbaniaArgentinaArmeniaAsiaAustraliaAustriaBahamasBangladeshBarbadosBelarusBelgiumBelizeBoliviaBosnia and HerzegovinaBrazilBulgariaBurma/MyanmarCabo VerdeCambodiaCameroonCanadaCaribbeanCentral AmericaChileChinaColombiaCongoCosta RicaCroatiaCubaCzechoslovakiaDenmarkDominicaDominican RepublicEastern AfricaEastern AsiaEastern EuropeEcuadorEgyptEl SalvadorEnglandEritreaEthiopiaEuropeFijiFranceGermanyGhanaGreeceGrenadaGuatemalaGuyanaHaitiHondurasHong KongHungaryIndiaIndonesiaIranIraqIrelandIsraelItalyJamaicaJapanJordanKazakhstanKenyaKoreaKuwaitLaosLatin AmericaLatviaLebanonLiberiaLithuaniaMalaysiaMexicoMicronesiaMiddle AfricaMoldovaMoroccoNepalNetherlandsNicaraguaNigeriaNorth AmericaNorth MacedoniaNorthern AfricaNorthern EuropeNorwayOceaniaPakistanPanamaPeruPhilippinesPolandPortugalRomaniaRussiaSaudi ArabiaScotlandSenegalSerbiaSierra LeoneSingaporeSomaliaSouth AfricaSouth AmericaSouth Central AsiaSouth Eastern AsiaSouthern EuropeSpainSri LankaSt. Vincent and the GrenadinesSudanSwedenSwitzerlandSyriaTaiwanThailandTrinidad and TobagoTurkeyUgandaUkraineUruguayUzbekistanVenezuelaVietnamWest IndiesWestern AfricaWestern AsiaWestern EuropeYemenZaireZimbabweAzores
10th Grade
Income
Poverty
Unemployment
Labor Participation
Family Structure
Vehicle Availability
Education Level
Disability

10th Grade Comparison

Burmese

Houma

Exceptional
Tragic
94.5%
10TH GRADE
97.1/ 100
METRIC RATING
110th/ 347
METRIC RANK
90.2%
10TH GRADE
0.0/ 100
METRIC RATING
320th/ 347
METRIC RANK

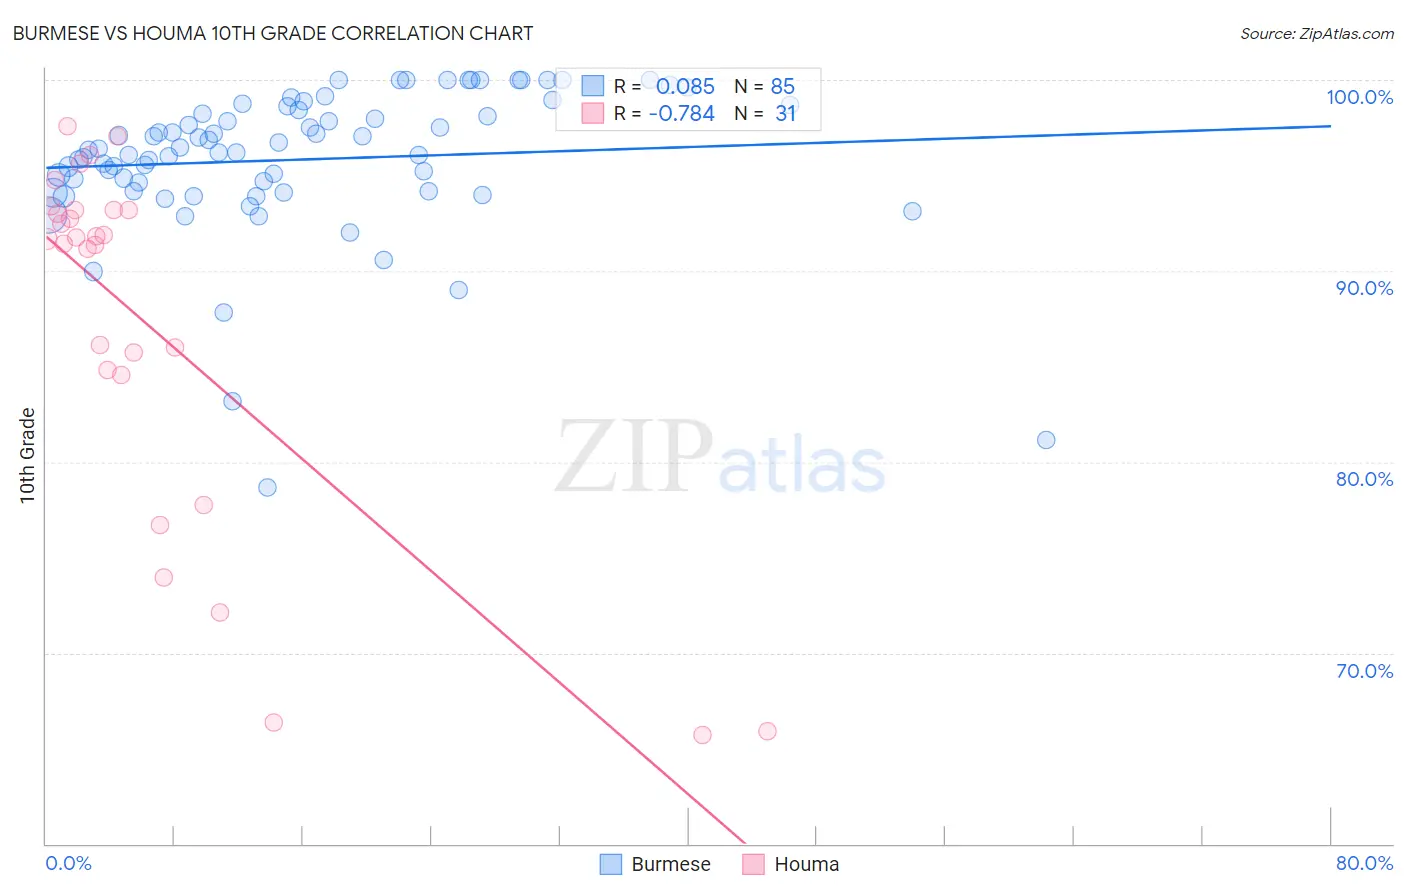
Burmese vs Houma 10th Grade Correlation Chart

The statistical analysis conducted on geographies consisting of 465,370,495 people shows a slight positive correlation between the proportion of Burmese and percentage of population with at least 10th grade education in the United States with a correlation coefficient (R) of 0.085 and weighted average of 94.5%. Similarly, the statistical analysis conducted on geographies consisting of 36,795,916 people shows a strong negative correlation between the proportion of Houma and percentage of population with at least 10th grade education in the United States with a correlation coefficient (R) of -0.784 and weighted average of 90.2%, a difference of 4.8%.
Burmese vs Houma 10th Grade

10th Grade Correlation Summary

MeasurementBurmeseHouma
Minimum78.7%65.7%
Maximum100.0%97.6%
Range21.3%31.9%
Mean95.8%87.1%
Median96.4%91.7%
Interquartile 25% (IQ1)94.2%84.5%
Interquartile 75% (IQ3)98.5%93.2%
Interquartile Range (IQR)4.3%8.6%
Standard Deviation (Sample)3.9%9.6%
Standard Deviation (Population)3.9%9.4%

Similar Demographics by 10th Grade

Demographics Similar to Burmese by 10th Grade

In terms of 10th grade, the demographic groups most similar to Burmese are Immigrants from North Macedonia (94.5%, a difference of 0.010%), Immigrants from Norway (94.5%, a difference of 0.010%), Immigrants from Serbia (94.5%, a difference of 0.020%), Immigrants from Croatia (94.5%, a difference of 0.020%), and Immigrants from Zimbabwe (94.4%, a difference of 0.020%).
DemographicsRating | Rank10th Grade
Immigrants | Europe
97.5
/100
|
#103
Exceptional
94.5%
Immigrants | Romania
97.5
/100
|
#104
Exceptional
94.5%
Immigrants | Turkey
97.4
/100
|
#105
Exceptional
94.5%
Immigrants | Serbia
97.4
/100
|
#106
Exceptional
94.5%
Immigrants | Croatia
97.4
/100
|
#107
Exceptional
94.5%
Immigrants | North Macedonia
97.2
/100
|
#108
Exceptional
94.5%
Immigrants | Norway
97.2
/100
|
#109
Exceptional
94.5%
Burmese
97.1
/100
|
#110
Exceptional
94.5%
Immigrants | Zimbabwe
96.8
/100
|
#111
Exceptional
94.4%
Immigrants | Kuwait
96.8
/100
|
#112
Exceptional
94.4%
Palestinians
96.5
/100
|
#113
Exceptional
94.4%
German Russians
96.3
/100
|
#114
Exceptional
94.4%
Delaware
96.3
/100
|
#115
Exceptional
94.4%
Sioux
96.2
/100
|
#116
Exceptional
94.4%
Immigrants | Hungary
95.8
/100
|
#117
Exceptional
94.4%

Demographics Similar to Houma by 10th Grade

In terms of 10th grade, the demographic groups most similar to Houma are Belizean (90.2%, a difference of 0.0%), Nicaraguan (90.2%, a difference of 0.010%), Tohono O'odham (90.1%, a difference of 0.010%), Immigrants from Cuba (90.2%, a difference of 0.090%), and Immigrants from Belize (90.1%, a difference of 0.11%).
DemographicsRating | Rank10th Grade
Cape Verdeans
0.0
/100
|
#313
Tragic
90.8%
Nepalese
0.0
/100
|
#314
Tragic
90.7%
Immigrants | Caribbean
0.0
/100
|
#315
Tragic
90.6%
Ecuadorians
0.0
/100
|
#316
Tragic
90.6%
Immigrants | Ecuador
0.0
/100
|
#317
Tragic
90.4%
Immigrants | Cuba
0.0
/100
|
#318
Tragic
90.2%
Nicaraguans
0.0
/100
|
#319
Tragic
90.2%
Houma
0.0
/100
|
#320
Tragic
90.2%
Belizeans
0.0
/100
|
#321
Tragic
90.2%
Tohono O'odham
0.0
/100
|
#322
Tragic
90.1%
Immigrants | Belize
0.0
/100
|
#323
Tragic
90.1%
Immigrants | Armenia
0.0
/100
|
#324
Tragic
89.9%
Puerto Ricans
0.0
/100
|
#325
Tragic
89.8%
Central American Indians
0.0
/100
|
#326
Tragic
89.7%
Immigrants | Nicaragua
0.0
/100
|
#327
Tragic
89.5%