Burmese vs French American Indian College, Under 1 year
COMPARE
Burmese
French American Indian
College, Under 1 year
College, Under 1 year Comparison
Burmese
French American Indians
71.9%
COLLEGE, UNDER 1 YEAR
100.0/ 100
METRIC RATING
15th/ 347
METRIC RANK
62.4%
COLLEGE, UNDER 1 YEAR
1.5/ 100
METRIC RATING
238th/ 347
METRIC RANK
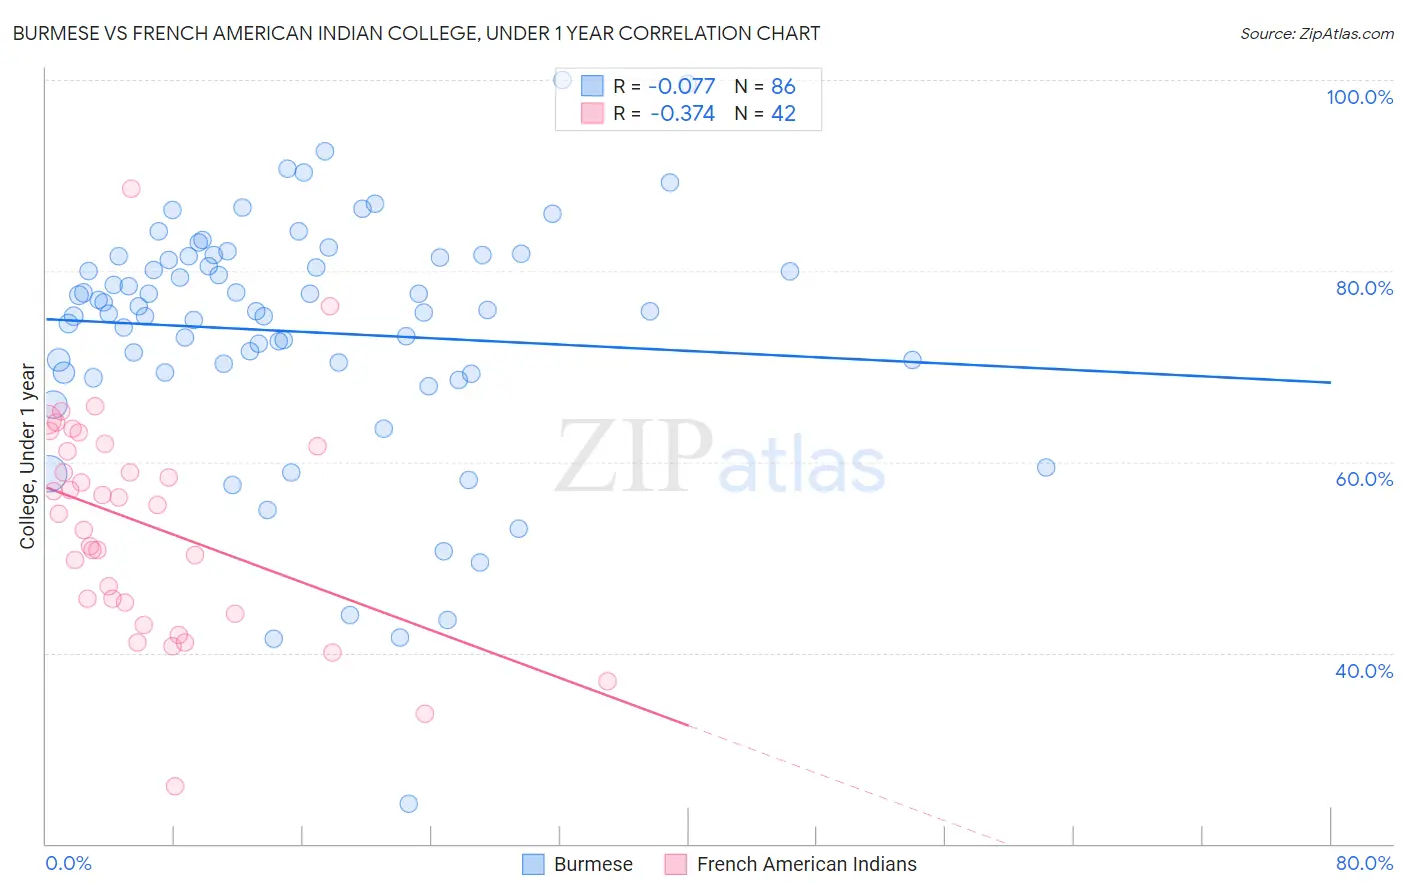
Burmese vs French American Indian College, Under 1 year Correlation Chart
The statistical analysis conducted on geographies consisting of 465,404,148 people shows a slight negative correlation between the proportion of Burmese and percentage of population with at least college, under 1 year education in the United States with a correlation coefficient (R) of -0.077 and weighted average of 71.9%. Similarly, the statistical analysis conducted on geographies consisting of 131,976,089 people shows a mild negative correlation between the proportion of French American Indians and percentage of population with at least college, under 1 year education in the United States with a correlation coefficient (R) of -0.374 and weighted average of 62.4%, a difference of 15.1%.
College, Under 1 year Correlation Summary
| Measurement | Burmese | French American Indian |
| Minimum | 24.2% | 26.1% |
| Maximum | 100.0% | 88.6% |
| Range | 75.8% | 62.5% |
| Mean | 73.6% | 53.5% |
| Median | 75.9% | 55.0% |
| Interquartile 25% (IQ1) | 69.4% | 45.3% |
| Interquartile 75% (IQ3) | 81.5% | 61.6% |
| Interquartile Range (IQR) | 12.1% | 16.3% |
| Standard Deviation (Sample) | 13.1% | 11.7% |
| Standard Deviation (Population) | 13.0% | 11.5% |
Similar Demographics by College, Under 1 year
Demographics Similar to Burmese by College, Under 1 year
In terms of college, under 1 year, the demographic groups most similar to Burmese are Cambodian (71.9%, a difference of 0.0%), Immigrants from Japan (71.9%, a difference of 0.010%), Cypriot (72.0%, a difference of 0.12%), Eastern European (71.8%, a difference of 0.16%), and Immigrants from South Central Asia (72.1%, a difference of 0.28%).
| Demographics | Rating | Rank | College, Under 1 year |
| Thais | 100.0 /100 | #8 | Exceptional 73.4% |
| Immigrants | Australia | 100.0 /100 | #9 | Exceptional 72.7% |
| Immigrants | Israel | 100.0 /100 | #10 | Exceptional 72.3% |
| Immigrants | South Central Asia | 100.0 /100 | #11 | Exceptional 72.1% |
| Immigrants | Sweden | 100.0 /100 | #12 | Exceptional 72.1% |
| Cypriots | 100.0 /100 | #13 | Exceptional 72.0% |
| Cambodians | 100.0 /100 | #14 | Exceptional 71.9% |
| Burmese | 100.0 /100 | #15 | Exceptional 71.9% |
| Immigrants | Japan | 100.0 /100 | #16 | Exceptional 71.9% |
| Eastern Europeans | 100.0 /100 | #17 | Exceptional 71.8% |
| Immigrants | Switzerland | 100.0 /100 | #18 | Exceptional 71.7% |
| Latvians | 100.0 /100 | #19 | Exceptional 71.6% |
| Immigrants | Korea | 100.0 /100 | #20 | Exceptional 71.6% |
| Immigrants | Belgium | 100.0 /100 | #21 | Exceptional 71.5% |
| Immigrants | Eastern Asia | 100.0 /100 | #22 | Exceptional 71.3% |
Demographics Similar to French American Indians by College, Under 1 year
In terms of college, under 1 year, the demographic groups most similar to French American Indians are Immigrants from Burma/Myanmar (62.5%, a difference of 0.090%), Immigrants (62.5%, a difference of 0.12%), Spanish American (62.6%, a difference of 0.25%), Chippewa (62.6%, a difference of 0.30%), and Iroquois (62.6%, a difference of 0.33%).
| Demographics | Rating | Rank | College, Under 1 year |
| Immigrants | Western Africa | 2.4 /100 | #231 | Tragic 62.8% |
| Osage | 2.2 /100 | #232 | Tragic 62.7% |
| Iroquois | 2.0 /100 | #233 | Tragic 62.6% |
| Chippewa | 2.0 /100 | #234 | Tragic 62.6% |
| Spanish Americans | 1.9 /100 | #235 | Tragic 62.6% |
| Immigrants | Immigrants | 1.7 /100 | #236 | Tragic 62.5% |
| Immigrants | Burma/Myanmar | 1.6 /100 | #237 | Tragic 62.5% |
| French American Indians | 1.5 /100 | #238 | Tragic 62.4% |
| Nepalese | 1.1 /100 | #239 | Tragic 62.2% |
| Aleuts | 1.1 /100 | #240 | Tragic 62.2% |
| Ottawa | 1.1 /100 | #241 | Tragic 62.2% |
| Malaysians | 1.1 /100 | #242 | Tragic 62.2% |
| Hawaiians | 1.1 /100 | #243 | Tragic 62.1% |
| Colville | 1.0 /100 | #244 | Tragic 62.1% |
| Delaware | 0.9 /100 | #245 | Tragic 62.1% |