African vs Puget Sound Salish Bachelor's Degree
COMPARE
African
Puget Sound Salish
Bachelor's Degree
Bachelor's Degree Comparison
Africans
Puget Sound Salish
32.9%
BACHELOR'S DEGREE
0.5/ 100
METRIC RATING
261st/ 347
METRIC RANK
30.7%
BACHELOR'S DEGREE
0.0/ 100
METRIC RATING
296th/ 347
METRIC RANK
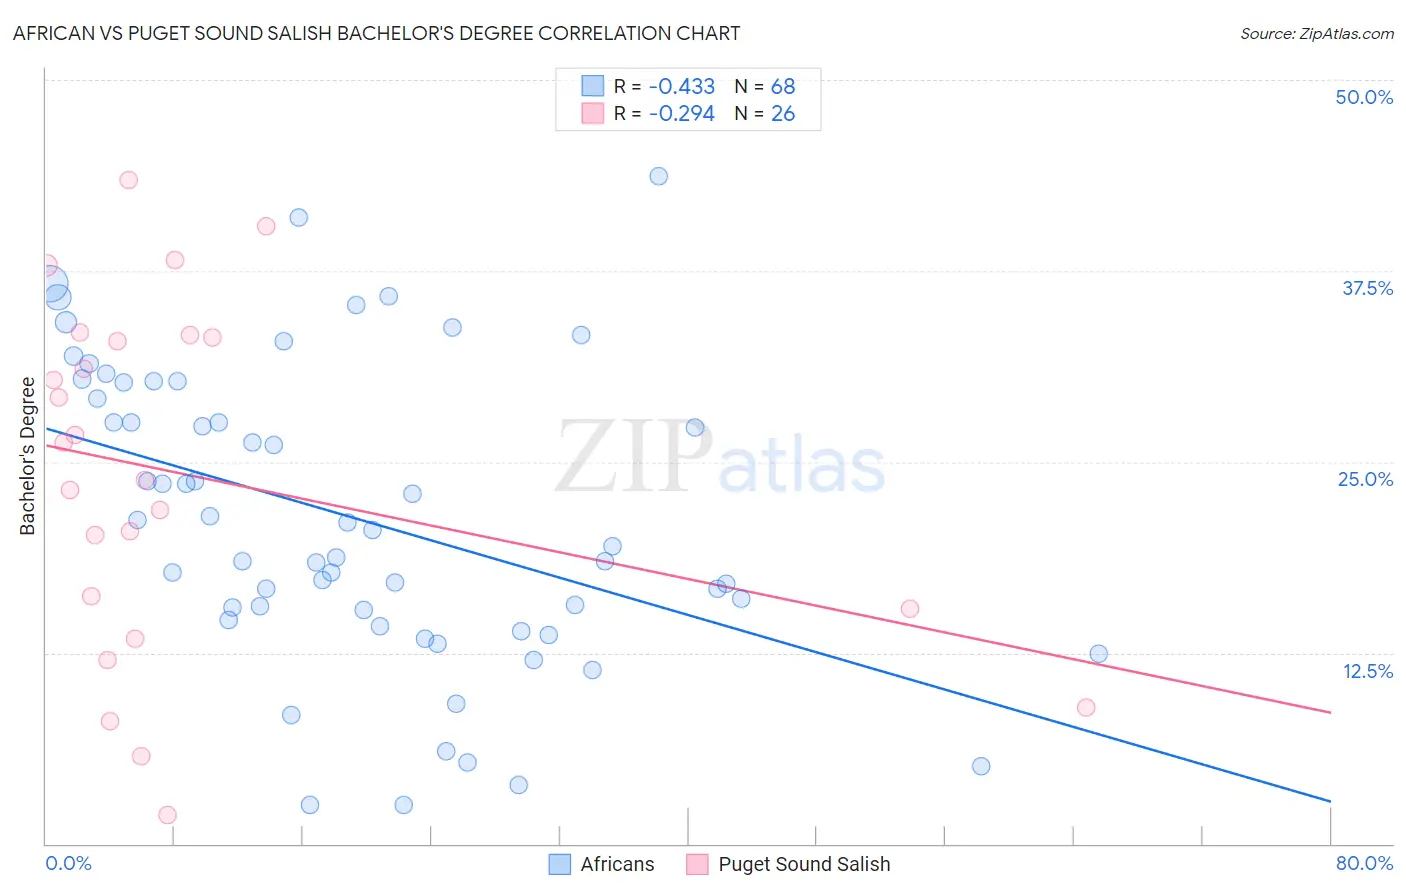
African vs Puget Sound Salish Bachelor's Degree Correlation Chart
The statistical analysis conducted on geographies consisting of 470,032,139 people shows a moderate negative correlation between the proportion of Africans and percentage of population with at least bachelor's degree education in the United States with a correlation coefficient (R) of -0.433 and weighted average of 32.9%. Similarly, the statistical analysis conducted on geographies consisting of 46,155,865 people shows a weak negative correlation between the proportion of Puget Sound Salish and percentage of population with at least bachelor's degree education in the United States with a correlation coefficient (R) of -0.294 and weighted average of 30.7%, a difference of 7.3%.
Bachelor's Degree Correlation Summary
| Measurement | African | Puget Sound Salish |
| Minimum | 2.5% | 1.9% |
| Maximum | 43.7% | 43.4% |
| Range | 41.2% | 41.6% |
| Mean | 21.3% | 24.1% |
| Median | 20.0% | 25.0% |
| Interquartile 25% (IQ1) | 15.0% | 15.4% |
| Interquartile 75% (IQ3) | 29.7% | 33.2% |
| Interquartile Range (IQR) | 14.7% | 17.8% |
| Standard Deviation (Sample) | 9.7% | 11.4% |
| Standard Deviation (Population) | 9.6% | 11.2% |
Similar Demographics by Bachelor's Degree
Demographics Similar to Africans by Bachelor's Degree
In terms of bachelor's degree, the demographic groups most similar to Africans are Immigrants from Jamaica (32.9%, a difference of 0.0%), Malaysian (32.9%, a difference of 0.090%), Belizean (32.8%, a difference of 0.29%), Osage (33.0%, a difference of 0.45%), and French American Indian (33.1%, a difference of 0.50%).
| Demographics | Rating | Rank | Bachelor's Degree |
| Native Hawaiians | 0.7 /100 | #254 | Tragic 33.2% |
| Iroquois | 0.7 /100 | #255 | Tragic 33.2% |
| Nicaraguans | 0.6 /100 | #256 | Tragic 33.1% |
| Spanish Americans | 0.6 /100 | #257 | Tragic 33.1% |
| French American Indians | 0.6 /100 | #258 | Tragic 33.1% |
| Osage | 0.5 /100 | #259 | Tragic 33.0% |
| Malaysians | 0.5 /100 | #260 | Tragic 32.9% |
| Africans | 0.5 /100 | #261 | Tragic 32.9% |
| Immigrants | Jamaica | 0.5 /100 | #262 | Tragic 32.9% |
| Belizeans | 0.4 /100 | #263 | Tragic 32.8% |
| Central American Indians | 0.3 /100 | #264 | Tragic 32.5% |
| Bahamians | 0.3 /100 | #265 | Tragic 32.5% |
| Immigrants | Dominica | 0.3 /100 | #266 | Tragic 32.5% |
| Cubans | 0.3 /100 | #267 | Tragic 32.5% |
| Immigrants | Portugal | 0.2 /100 | #268 | Tragic 32.2% |
Demographics Similar to Puget Sound Salish by Bachelor's Degree
In terms of bachelor's degree, the demographic groups most similar to Puget Sound Salish are Immigrants from Haiti (30.6%, a difference of 0.060%), Immigrants from Dominican Republic (30.7%, a difference of 0.10%), Chippewa (30.6%, a difference of 0.31%), Immigrants from Guatemala (30.8%, a difference of 0.34%), and Cape Verdean (30.9%, a difference of 0.74%).
| Demographics | Rating | Rank | Bachelor's Degree |
| Puerto Ricans | 0.1 /100 | #289 | Tragic 31.0% |
| Immigrants | Honduras | 0.1 /100 | #290 | Tragic 30.9% |
| Blacks/African Americans | 0.1 /100 | #291 | Tragic 30.9% |
| Ute | 0.1 /100 | #292 | Tragic 30.9% |
| Cape Verdeans | 0.1 /100 | #293 | Tragic 30.9% |
| Immigrants | Guatemala | 0.0 /100 | #294 | Tragic 30.8% |
| Immigrants | Dominican Republic | 0.0 /100 | #295 | Tragic 30.7% |
| Puget Sound Salish | 0.0 /100 | #296 | Tragic 30.7% |
| Immigrants | Haiti | 0.0 /100 | #297 | Tragic 30.6% |
| Chippewa | 0.0 /100 | #298 | Tragic 30.6% |
| Chickasaw | 0.0 /100 | #299 | Tragic 30.4% |
| Immigrants | Micronesia | 0.0 /100 | #300 | Tragic 30.4% |
| Immigrants | Cuba | 0.0 /100 | #301 | Tragic 30.3% |
| Mexican American Indians | 0.0 /100 | #302 | Tragic 30.2% |
| Bangladeshis | 0.0 /100 | #303 | Tragic 30.2% |