Swiss vs Puget Sound Salish Bachelor's Degree
COMPARE
Swiss
Puget Sound Salish
Bachelor's Degree
Bachelor's Degree Comparison
Swiss
Puget Sound Salish
37.2%
BACHELOR'S DEGREE
34.1/ 100
METRIC RATING
190th/ 347
METRIC RANK
30.7%
BACHELOR'S DEGREE
0.0/ 100
METRIC RATING
296th/ 347
METRIC RANK
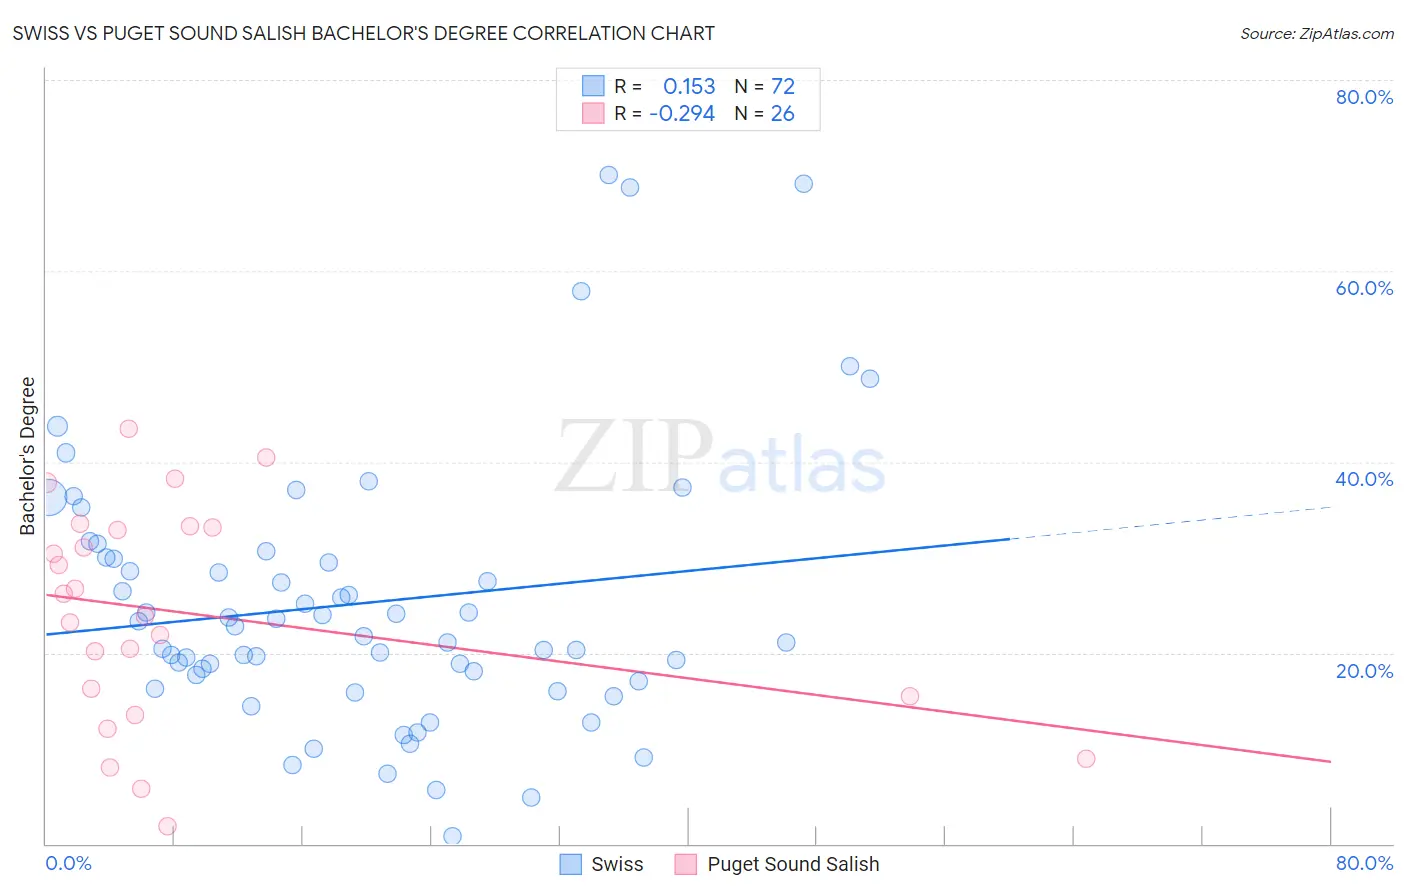
Swiss vs Puget Sound Salish Bachelor's Degree Correlation Chart
The statistical analysis conducted on geographies consisting of 464,980,651 people shows a poor positive correlation between the proportion of Swiss and percentage of population with at least bachelor's degree education in the United States with a correlation coefficient (R) of 0.153 and weighted average of 37.2%. Similarly, the statistical analysis conducted on geographies consisting of 46,155,865 people shows a weak negative correlation between the proportion of Puget Sound Salish and percentage of population with at least bachelor's degree education in the United States with a correlation coefficient (R) of -0.294 and weighted average of 30.7%, a difference of 21.4%.
Bachelor's Degree Correlation Summary
| Measurement | Swiss | Puget Sound Salish |
| Minimum | 0.82% | 1.9% |
| Maximum | 70.0% | 43.4% |
| Range | 69.2% | 41.6% |
| Mean | 25.2% | 24.1% |
| Median | 22.2% | 25.0% |
| Interquartile 25% (IQ1) | 17.3% | 15.4% |
| Interquartile 75% (IQ3) | 29.9% | 33.2% |
| Interquartile Range (IQR) | 12.6% | 17.8% |
| Standard Deviation (Sample) | 14.1% | 11.4% |
| Standard Deviation (Population) | 14.0% | 11.2% |
Similar Demographics by Bachelor's Degree
Demographics Similar to Swiss by Bachelor's Degree
In terms of bachelor's degree, the demographic groups most similar to Swiss are Nigerian (37.2%, a difference of 0.020%), Immigrants from Vietnam (37.1%, a difference of 0.22%), Yugoslavian (37.1%, a difference of 0.29%), Slovak (37.3%, a difference of 0.30%), and Immigrants from Oceania (37.3%, a difference of 0.35%).
| Demographics | Rating | Rank | Bachelor's Degree |
| Senegalese | 42.2 /100 | #183 | Average 37.5% |
| Scandinavians | 41.7 /100 | #184 | Average 37.5% |
| Immigrants | Peru | 41.3 /100 | #185 | Average 37.5% |
| Norwegians | 40.4 /100 | #186 | Average 37.5% |
| English | 39.7 /100 | #187 | Fair 37.4% |
| Immigrants | Oceania | 37.3 /100 | #188 | Fair 37.3% |
| Slovaks | 36.9 /100 | #189 | Fair 37.3% |
| Swiss | 34.1 /100 | #190 | Fair 37.2% |
| Nigerians | 33.9 /100 | #191 | Fair 37.2% |
| Immigrants | Vietnam | 32.1 /100 | #192 | Fair 37.1% |
| Yugoslavians | 31.5 /100 | #193 | Fair 37.1% |
| Belgians | 29.9 /100 | #194 | Fair 37.0% |
| Koreans | 29.8 /100 | #195 | Fair 37.0% |
| Celtics | 29.5 /100 | #196 | Fair 37.0% |
| Czechoslovakians | 29.2 /100 | #197 | Fair 37.0% |
Demographics Similar to Puget Sound Salish by Bachelor's Degree
In terms of bachelor's degree, the demographic groups most similar to Puget Sound Salish are Immigrants from Haiti (30.6%, a difference of 0.060%), Immigrants from Dominican Republic (30.7%, a difference of 0.10%), Chippewa (30.6%, a difference of 0.31%), Immigrants from Guatemala (30.8%, a difference of 0.34%), and Cape Verdean (30.9%, a difference of 0.74%).
| Demographics | Rating | Rank | Bachelor's Degree |
| Puerto Ricans | 0.1 /100 | #289 | Tragic 31.0% |
| Immigrants | Honduras | 0.1 /100 | #290 | Tragic 30.9% |
| Blacks/African Americans | 0.1 /100 | #291 | Tragic 30.9% |
| Ute | 0.1 /100 | #292 | Tragic 30.9% |
| Cape Verdeans | 0.1 /100 | #293 | Tragic 30.9% |
| Immigrants | Guatemala | 0.0 /100 | #294 | Tragic 30.8% |
| Immigrants | Dominican Republic | 0.0 /100 | #295 | Tragic 30.7% |
| Puget Sound Salish | 0.0 /100 | #296 | Tragic 30.7% |
| Immigrants | Haiti | 0.0 /100 | #297 | Tragic 30.6% |
| Chippewa | 0.0 /100 | #298 | Tragic 30.6% |
| Chickasaw | 0.0 /100 | #299 | Tragic 30.4% |
| Immigrants | Micronesia | 0.0 /100 | #300 | Tragic 30.4% |
| Immigrants | Cuba | 0.0 /100 | #301 | Tragic 30.3% |
| Mexican American Indians | 0.0 /100 | #302 | Tragic 30.2% |
| Bangladeshis | 0.0 /100 | #303 | Tragic 30.2% |