Bulgarian vs Immigrants from Grenada 11th Grade
COMPARE
Bulgarian
Immigrants from Grenada
11th Grade
11th Grade Comparison
Bulgarians
Immigrants from Grenada
94.5%
11TH GRADE
100.0/ 100
METRIC RATING
15th/ 347
METRIC RANK
90.1%
11TH GRADE
0.0/ 100
METRIC RATING
294th/ 347
METRIC RANK
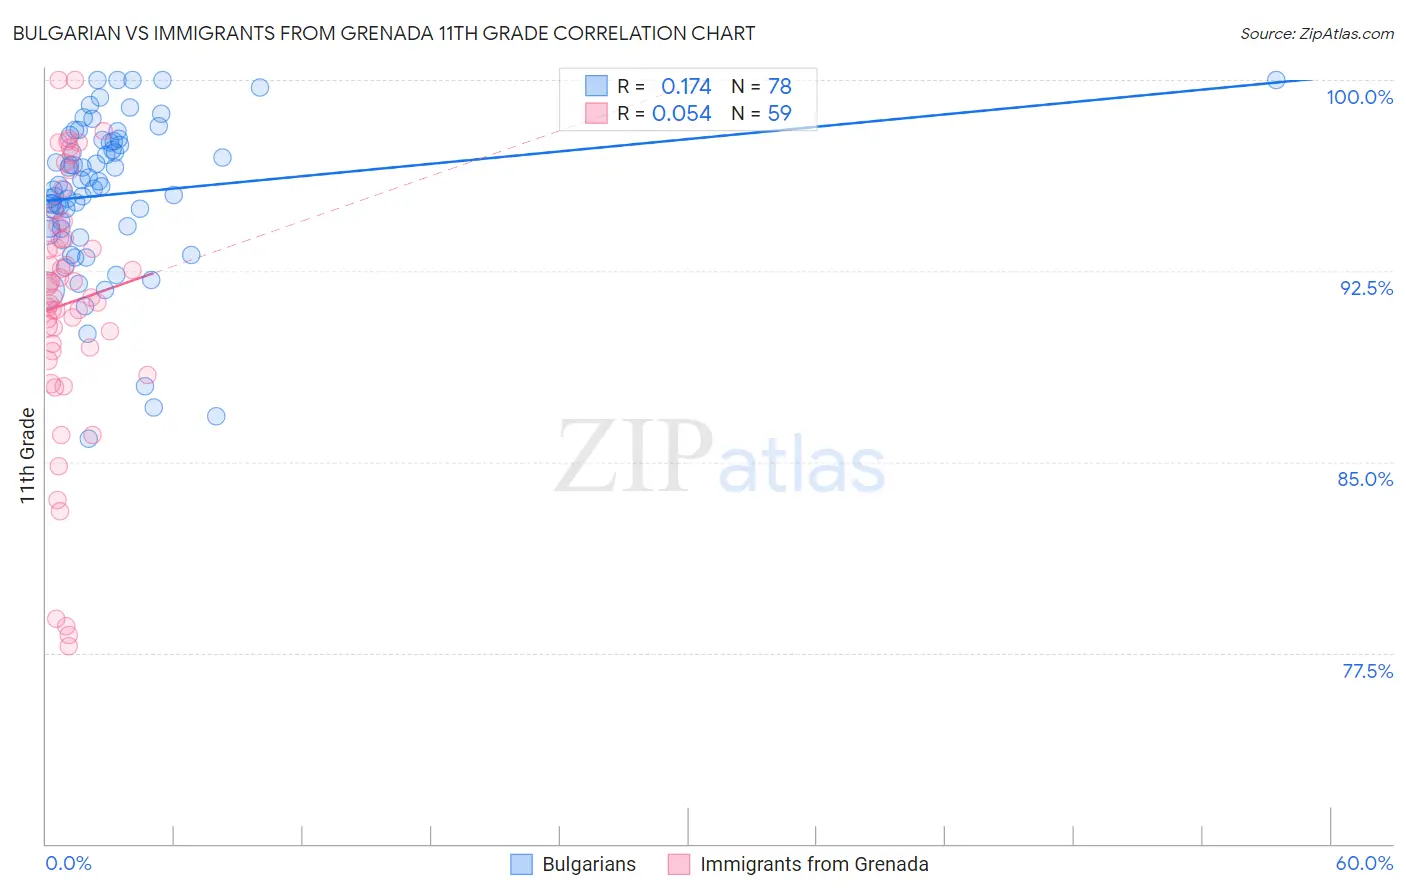
Bulgarian vs Immigrants from Grenada 11th Grade Correlation Chart
The statistical analysis conducted on geographies consisting of 205,633,404 people shows a poor positive correlation between the proportion of Bulgarians and percentage of population with at least 11th grade education in the United States with a correlation coefficient (R) of 0.174 and weighted average of 94.5%. Similarly, the statistical analysis conducted on geographies consisting of 67,201,908 people shows a slight positive correlation between the proportion of Immigrants from Grenada and percentage of population with at least 11th grade education in the United States with a correlation coefficient (R) of 0.054 and weighted average of 90.1%, a difference of 4.8%.
11th Grade Correlation Summary
| Measurement | Bulgarian | Immigrants from Grenada |
| Minimum | 85.9% | 77.8% |
| Maximum | 100.0% | 100.0% |
| Range | 14.1% | 22.2% |
| Mean | 95.5% | 91.2% |
| Median | 95.8% | 91.5% |
| Interquartile 25% (IQ1) | 94.2% | 89.4% |
| Interquartile 75% (IQ3) | 97.6% | 94.3% |
| Interquartile Range (IQR) | 3.4% | 5.0% |
| Standard Deviation (Sample) | 3.0% | 5.1% |
| Standard Deviation (Population) | 3.0% | 5.1% |
Similar Demographics by 11th Grade
Demographics Similar to Bulgarians by 11th Grade
In terms of 11th grade, the demographic groups most similar to Bulgarians are Immigrants from India (94.5%, a difference of 0.010%), Luxembourger (94.5%, a difference of 0.010%), Maltese (94.5%, a difference of 0.010%), Scandinavian (94.5%, a difference of 0.010%), and Italian (94.5%, a difference of 0.050%).
| Demographics | Rating | Rank | 11th Grade |
| Croatians | 100.0 /100 | #8 | Exceptional 94.7% |
| Danes | 100.0 /100 | #9 | Exceptional 94.7% |
| Finns | 100.0 /100 | #10 | Exceptional 94.7% |
| Germans | 100.0 /100 | #11 | Exceptional 94.7% |
| Latvians | 100.0 /100 | #12 | Exceptional 94.7% |
| Chinese | 100.0 /100 | #13 | Exceptional 94.6% |
| Eastern Europeans | 100.0 /100 | #14 | Exceptional 94.6% |
| Bulgarians | 100.0 /100 | #15 | Exceptional 94.5% |
| Immigrants | India | 100.0 /100 | #16 | Exceptional 94.5% |
| Luxembourgers | 100.0 /100 | #17 | Exceptional 94.5% |
| Maltese | 100.0 /100 | #18 | Exceptional 94.5% |
| Scandinavians | 100.0 /100 | #19 | Exceptional 94.5% |
| Italians | 100.0 /100 | #20 | Exceptional 94.5% |
| Tlingit-Haida | 100.0 /100 | #21 | Exceptional 94.4% |
| Tsimshian | 100.0 /100 | #22 | Exceptional 94.4% |
Demographics Similar to Immigrants from Grenada by 11th Grade
In terms of 11th grade, the demographic groups most similar to Immigrants from Grenada are Native/Alaskan (90.2%, a difference of 0.050%), Immigrants from Vietnam (90.0%, a difference of 0.11%), Cuban (90.2%, a difference of 0.12%), Fijian (90.0%, a difference of 0.12%), and Haitian (90.3%, a difference of 0.14%).
| Demographics | Rating | Rank | 11th Grade |
| Apache | 0.0 /100 | #287 | Tragic 90.4% |
| Pennsylvania Germans | 0.0 /100 | #288 | Tragic 90.3% |
| British West Indians | 0.0 /100 | #289 | Tragic 90.3% |
| Indonesians | 0.0 /100 | #290 | Tragic 90.3% |
| Haitians | 0.0 /100 | #291 | Tragic 90.3% |
| Cubans | 0.0 /100 | #292 | Tragic 90.2% |
| Natives/Alaskans | 0.0 /100 | #293 | Tragic 90.2% |
| Immigrants | Grenada | 0.0 /100 | #294 | Tragic 90.1% |
| Immigrants | Vietnam | 0.0 /100 | #295 | Tragic 90.0% |
| Fijians | 0.0 /100 | #296 | Tragic 90.0% |
| Navajo | 0.0 /100 | #297 | Tragic 90.0% |
| Immigrants | Fiji | 0.0 /100 | #298 | Tragic 89.9% |
| Japanese | 0.0 /100 | #299 | Tragic 89.9% |
| Immigrants | Haiti | 0.0 /100 | #300 | Tragic 89.9% |
| Guyanese | 0.0 /100 | #301 | Tragic 89.9% |