British vs Indonesian 9th Grade
COMPARE
British
Indonesian
9th Grade
9th Grade Comparison
British
Indonesians
96.3%
9TH GRADE
100.0/ 100
METRIC RATING
31st/ 347
METRIC RANK
93.1%
9TH GRADE
0.0/ 100
METRIC RATING
296th/ 347
METRIC RANK
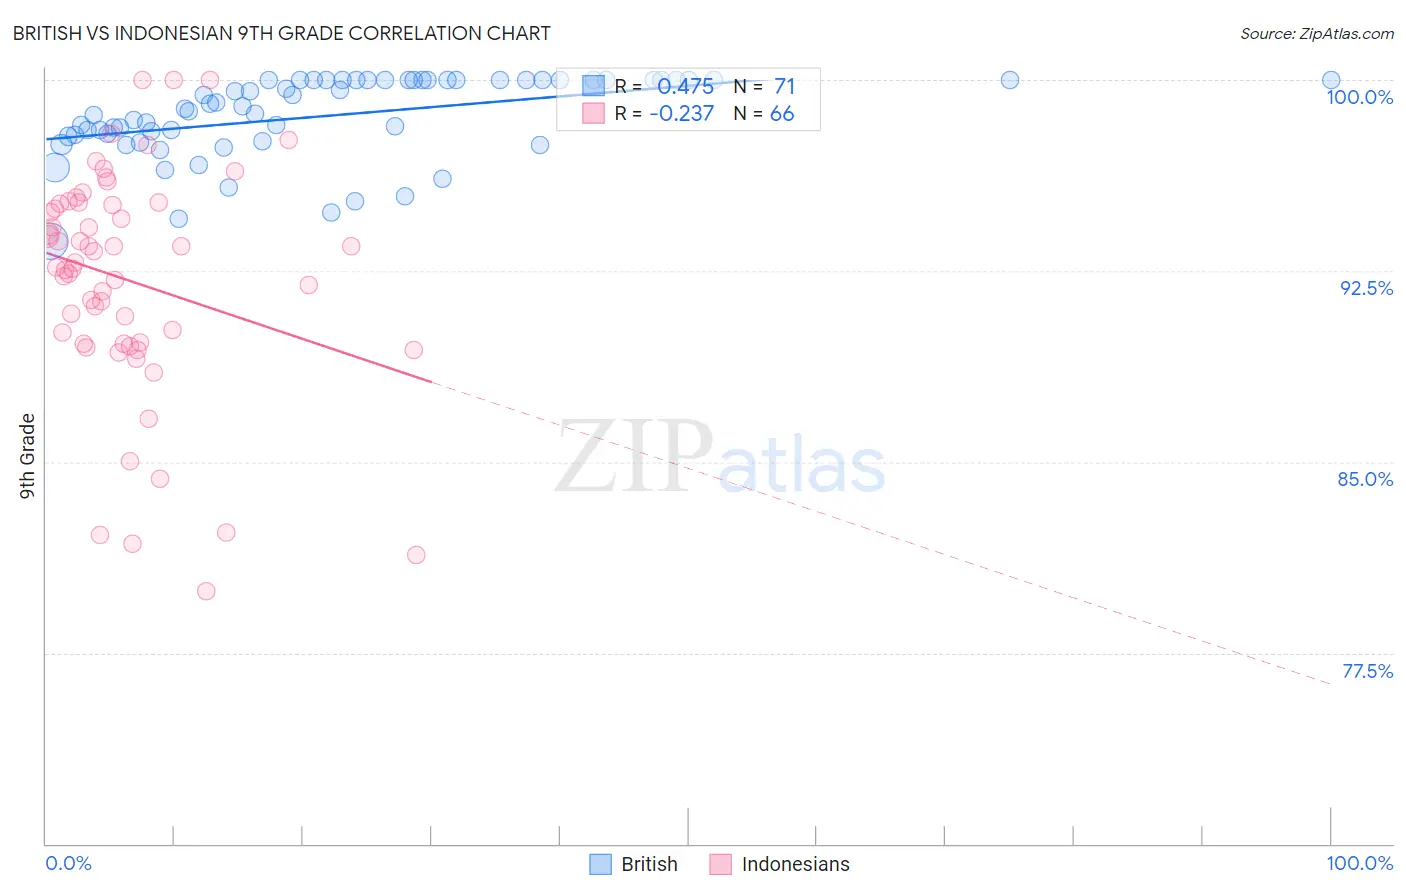
British vs Indonesian 9th Grade Correlation Chart
The statistical analysis conducted on geographies consisting of 531,463,107 people shows a moderate positive correlation between the proportion of British and percentage of population with at least 9th grade education in the United States with a correlation coefficient (R) of 0.475 and weighted average of 96.3%. Similarly, the statistical analysis conducted on geographies consisting of 162,727,113 people shows a weak negative correlation between the proportion of Indonesians and percentage of population with at least 9th grade education in the United States with a correlation coefficient (R) of -0.237 and weighted average of 93.1%, a difference of 3.4%.
9th Grade Correlation Summary
| Measurement | British | Indonesian |
| Minimum | 93.7% | 79.9% |
| Maximum | 100.0% | 100.0% |
| Range | 6.3% | 20.1% |
| Mean | 98.6% | 92.1% |
| Median | 99.0% | 92.7% |
| Interquartile 25% (IQ1) | 97.8% | 89.6% |
| Interquartile 75% (IQ3) | 100.0% | 95.1% |
| Interquartile Range (IQR) | 2.2% | 5.5% |
| Standard Deviation (Sample) | 1.6% | 4.5% |
| Standard Deviation (Population) | 1.6% | 4.4% |
Similar Demographics by 9th Grade
Demographics Similar to British by 9th Grade
In terms of 9th grade, the demographic groups most similar to British are Maltese (96.3%, a difference of 0.0%), Belgian (96.3%, a difference of 0.0%), Luxembourger (96.3%, a difference of 0.010%), Scotch-Irish (96.3%, a difference of 0.030%), and Eastern European (96.3%, a difference of 0.030%).
| Demographics | Rating | Rank | 9th Grade |
| Latvians | 100.0 /100 | #24 | Exceptional 96.4% |
| French | 100.0 /100 | #25 | Exceptional 96.3% |
| French Canadians | 100.0 /100 | #26 | Exceptional 96.3% |
| Scotch-Irish | 100.0 /100 | #27 | Exceptional 96.3% |
| Eastern Europeans | 100.0 /100 | #28 | Exceptional 96.3% |
| Chinese | 100.0 /100 | #29 | Exceptional 96.3% |
| Maltese | 100.0 /100 | #30 | Exceptional 96.3% |
| British | 100.0 /100 | #31 | Exceptional 96.3% |
| Belgians | 100.0 /100 | #32 | Exceptional 96.3% |
| Luxembourgers | 100.0 /100 | #33 | Exceptional 96.3% |
| Hungarians | 100.0 /100 | #34 | Exceptional 96.2% |
| Bulgarians | 99.9 /100 | #35 | Exceptional 96.2% |
| Northern Europeans | 99.9 /100 | #36 | Exceptional 96.2% |
| Estonians | 99.9 /100 | #37 | Exceptional 96.1% |
| Immigrants | Scotland | 99.9 /100 | #38 | Exceptional 96.1% |
Demographics Similar to Indonesians by 9th Grade
In terms of 9th grade, the demographic groups most similar to Indonesians are Immigrants from Burma/Myanmar (93.1%, a difference of 0.0%), Cuban (93.2%, a difference of 0.020%), Sri Lankan (93.2%, a difference of 0.030%), Fijian (93.1%, a difference of 0.030%), and Immigrants from Laos (93.2%, a difference of 0.040%).
| Demographics | Rating | Rank | 9th Grade |
| Immigrants | West Indies | 0.0 /100 | #289 | Tragic 93.3% |
| Pennsylvania Germans | 0.0 /100 | #290 | Tragic 93.3% |
| British West Indians | 0.0 /100 | #291 | Tragic 93.2% |
| Immigrants | Laos | 0.0 /100 | #292 | Tragic 93.2% |
| Sri Lankans | 0.0 /100 | #293 | Tragic 93.2% |
| Cubans | 0.0 /100 | #294 | Tragic 93.2% |
| Immigrants | Burma/Myanmar | 0.0 /100 | #295 | Tragic 93.1% |
| Indonesians | 0.0 /100 | #296 | Tragic 93.1% |
| Fijians | 0.0 /100 | #297 | Tragic 93.1% |
| Haitians | 0.0 /100 | #298 | Tragic 93.1% |
| Immigrants | Grenada | 0.0 /100 | #299 | Tragic 93.0% |
| Yaqui | 0.0 /100 | #300 | Tragic 92.9% |
| Immigrants | Haiti | 0.0 /100 | #301 | Tragic 92.7% |
| Immigrants | Dominica | 0.0 /100 | #302 | Tragic 92.7% |
| Guyanese | 0.0 /100 | #303 | Tragic 92.7% |