British vs Immigrants from Caribbean 10th Grade
COMPARE
British
Immigrants from Caribbean
10th Grade
10th Grade Comparison
British
Immigrants from Caribbean
95.3%
10TH GRADE
99.9/ 100
METRIC RATING
34th/ 347
METRIC RANK
90.6%
10TH GRADE
0.0/ 100
METRIC RATING
315th/ 347
METRIC RANK
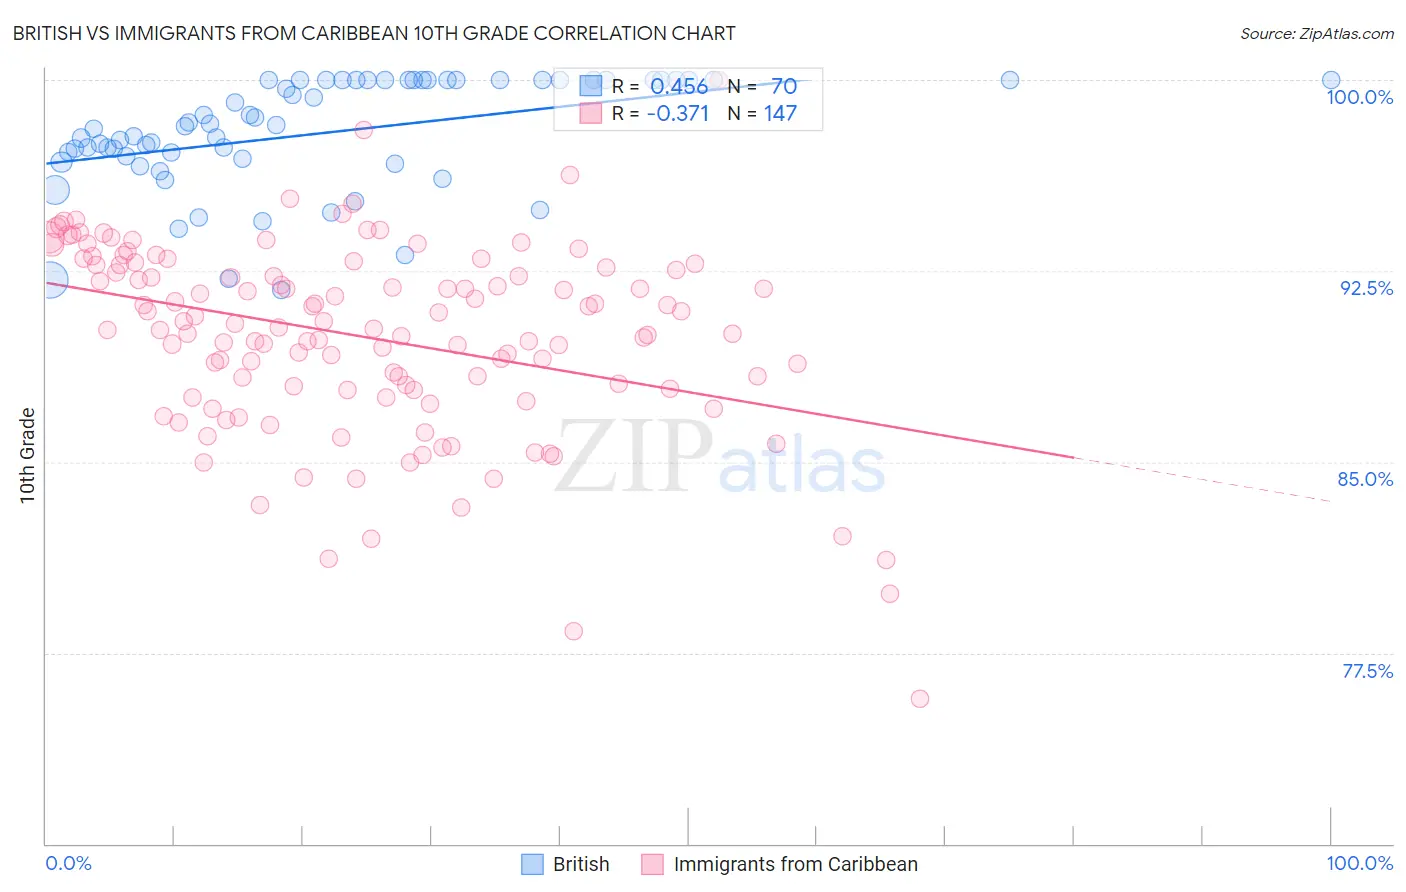
British vs Immigrants from Caribbean 10th Grade Correlation Chart
The statistical analysis conducted on geographies consisting of 531,463,601 people shows a moderate positive correlation between the proportion of British and percentage of population with at least 10th grade education in the United States with a correlation coefficient (R) of 0.456 and weighted average of 95.3%. Similarly, the statistical analysis conducted on geographies consisting of 450,064,654 people shows a mild negative correlation between the proportion of Immigrants from Caribbean and percentage of population with at least 10th grade education in the United States with a correlation coefficient (R) of -0.371 and weighted average of 90.6%, a difference of 5.2%.
10th Grade Correlation Summary
| Measurement | British | Immigrants from Caribbean |
| Minimum | 91.8% | 75.7% |
| Maximum | 100.0% | 100.0% |
| Range | 8.2% | 24.3% |
| Mean | 97.9% | 89.9% |
| Median | 98.2% | 90.3% |
| Interquartile 25% (IQ1) | 96.9% | 87.8% |
| Interquartile 75% (IQ3) | 100.0% | 92.7% |
| Interquartile Range (IQR) | 3.1% | 4.9% |
| Standard Deviation (Sample) | 2.2% | 3.8% |
| Standard Deviation (Population) | 2.2% | 3.8% |
Similar Demographics by 10th Grade
Demographics Similar to British by 10th Grade
In terms of 10th grade, the demographic groups most similar to British are Iranian (95.3%, a difference of 0.010%), Hungarian (95.3%, a difference of 0.010%), French (95.3%, a difference of 0.010%), Estonian (95.3%, a difference of 0.010%), and Immigrants from India (95.3%, a difference of 0.020%).
| Demographics | Rating | Rank | 10th Grade |
| Alaskan Athabascans | 100.0 /100 | #27 | Exceptional 95.4% |
| Luxembourgers | 100.0 /100 | #28 | Exceptional 95.4% |
| Bulgarians | 100.0 /100 | #29 | Exceptional 95.4% |
| Belgians | 100.0 /100 | #30 | Exceptional 95.4% |
| Iranians | 100.0 /100 | #31 | Exceptional 95.3% |
| Hungarians | 100.0 /100 | #32 | Exceptional 95.3% |
| French | 100.0 /100 | #33 | Exceptional 95.3% |
| British | 99.9 /100 | #34 | Exceptional 95.3% |
| Estonians | 99.9 /100 | #35 | Exceptional 95.3% |
| Immigrants | India | 99.9 /100 | #36 | Exceptional 95.3% |
| French Canadians | 99.9 /100 | #37 | Exceptional 95.3% |
| Northern Europeans | 99.9 /100 | #38 | Exceptional 95.3% |
| Immigrants | Scotland | 99.9 /100 | #39 | Exceptional 95.2% |
| Scotch-Irish | 99.9 /100 | #40 | Exceptional 95.2% |
| Russians | 99.9 /100 | #41 | Exceptional 95.2% |
Demographics Similar to Immigrants from Caribbean by 10th Grade
In terms of 10th grade, the demographic groups most similar to Immigrants from Caribbean are Ecuadorian (90.6%, a difference of 0.010%), Nepalese (90.7%, a difference of 0.080%), Cape Verdean (90.8%, a difference of 0.16%), Immigrants from Ecuador (90.4%, a difference of 0.18%), and Immigrants from Portugal (90.8%, a difference of 0.19%).
| Demographics | Rating | Rank | 10th Grade |
| Immigrants | Bangladesh | 0.0 /100 | #308 | Tragic 91.0% |
| Immigrants | Immigrants | 0.0 /100 | #309 | Tragic 91.0% |
| Vietnamese | 0.0 /100 | #310 | Tragic 90.9% |
| Immigrants | Cambodia | 0.0 /100 | #311 | Tragic 90.9% |
| Immigrants | Portugal | 0.0 /100 | #312 | Tragic 90.8% |
| Cape Verdeans | 0.0 /100 | #313 | Tragic 90.8% |
| Nepalese | 0.0 /100 | #314 | Tragic 90.7% |
| Immigrants | Caribbean | 0.0 /100 | #315 | Tragic 90.6% |
| Ecuadorians | 0.0 /100 | #316 | Tragic 90.6% |
| Immigrants | Ecuador | 0.0 /100 | #317 | Tragic 90.4% |
| Immigrants | Cuba | 0.0 /100 | #318 | Tragic 90.2% |
| Nicaraguans | 0.0 /100 | #319 | Tragic 90.2% |
| Houma | 0.0 /100 | #320 | Tragic 90.2% |
| Belizeans | 0.0 /100 | #321 | Tragic 90.2% |
| Tohono O'odham | 0.0 /100 | #322 | Tragic 90.1% |