Japanese vs Immigrants from Ecuador Doctorate Degree
COMPARE
Japanese
Immigrants from Ecuador
Doctorate Degree
Doctorate Degree Comparison
Japanese
Immigrants from Ecuador
1.5%
DOCTORATE DEGREE
0.9/ 100
METRIC RATING
260th/ 347
METRIC RANK
1.4%
DOCTORATE DEGREE
0.2/ 100
METRIC RATING
296th/ 347
METRIC RANK
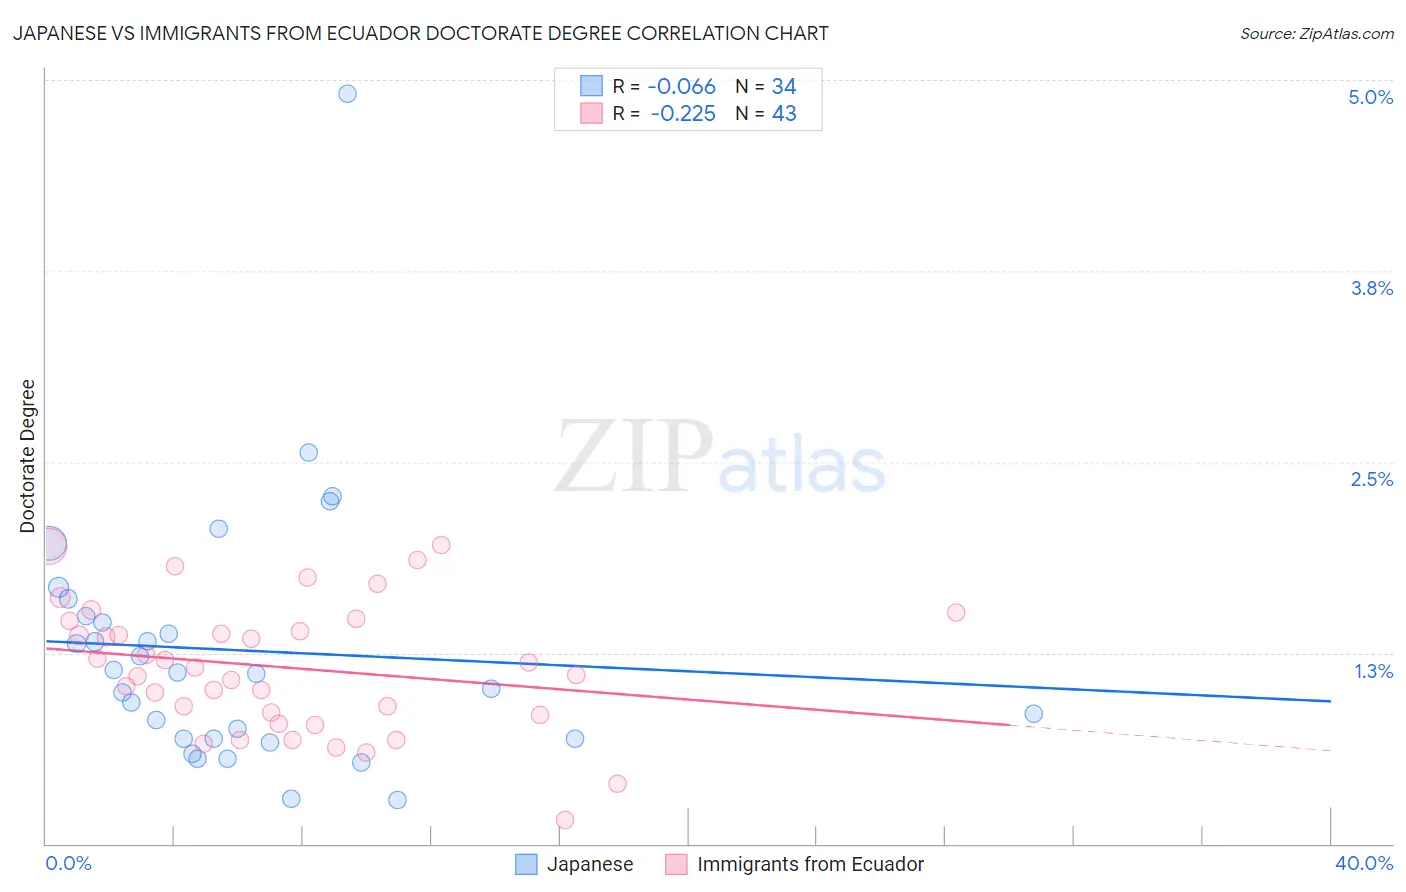
Japanese vs Immigrants from Ecuador Doctorate Degree Correlation Chart
The statistical analysis conducted on geographies consisting of 247,895,827 people shows a slight negative correlation between the proportion of Japanese and percentage of population with at least doctorate degree education in the United States with a correlation coefficient (R) of -0.066 and weighted average of 1.5%. Similarly, the statistical analysis conducted on geographies consisting of 269,753,528 people shows a weak negative correlation between the proportion of Immigrants from Ecuador and percentage of population with at least doctorate degree education in the United States with a correlation coefficient (R) of -0.225 and weighted average of 1.4%, a difference of 7.8%.
Doctorate Degree Correlation Summary
| Measurement | Japanese | Immigrants from Ecuador |
| Minimum | 0.29% | 0.16% |
| Maximum | 4.9% | 2.0% |
| Range | 4.6% | 1.8% |
| Mean | 1.3% | 1.2% |
| Median | 1.1% | 1.2% |
| Interquartile 25% (IQ1) | 0.69% | 0.84% |
| Interquartile 75% (IQ3) | 1.5% | 1.5% |
| Interquartile Range (IQR) | 0.80% | 0.62% |
| Standard Deviation (Sample) | 0.87% | 0.42% |
| Standard Deviation (Population) | 0.85% | 0.42% |
Similar Demographics by Doctorate Degree
Demographics Similar to Japanese by Doctorate Degree
In terms of doctorate degree, the demographic groups most similar to Japanese are Liberian (1.5%, a difference of 0.10%), Immigrants from West Indies (1.5%, a difference of 0.12%), Chippewa (1.5%, a difference of 0.38%), Immigrants from Portugal (1.5%, a difference of 0.46%), and Central American Indian (1.5%, a difference of 0.60%).
| Demographics | Rating | Rank | Doctorate Degree |
| Americans | 1.0 /100 | #253 | Tragic 1.5% |
| Immigrants | Cambodia | 1.0 /100 | #254 | Tragic 1.5% |
| Trinidadians and Tobagonians | 1.0 /100 | #255 | Tragic 1.5% |
| Central American Indians | 1.0 /100 | #256 | Tragic 1.5% |
| Chippewa | 0.9 /100 | #257 | Tragic 1.5% |
| Immigrants | West Indies | 0.9 /100 | #258 | Tragic 1.5% |
| Liberians | 0.9 /100 | #259 | Tragic 1.5% |
| Japanese | 0.9 /100 | #260 | Tragic 1.5% |
| Immigrants | Portugal | 0.8 /100 | #261 | Tragic 1.5% |
| Chickasaw | 0.7 /100 | #262 | Tragic 1.5% |
| Immigrants | Bahamas | 0.7 /100 | #263 | Tragic 1.5% |
| Blackfeet | 0.7 /100 | #264 | Tragic 1.5% |
| Nicaraguans | 0.6 /100 | #265 | Tragic 1.5% |
| Immigrants | Liberia | 0.5 /100 | #266 | Tragic 1.5% |
| Kiowa | 0.5 /100 | #267 | Tragic 1.5% |
Demographics Similar to Immigrants from Ecuador by Doctorate Degree
In terms of doctorate degree, the demographic groups most similar to Immigrants from Ecuador are Tsimshian (1.4%, a difference of 0.22%), Guatemalan (1.4%, a difference of 0.23%), Puerto Rican (1.4%, a difference of 0.63%), Samoan (1.4%, a difference of 0.94%), and Belizean (1.4%, a difference of 1.1%).
| Demographics | Rating | Rank | Doctorate Degree |
| Cape Verdeans | 0.3 /100 | #289 | Tragic 1.4% |
| Choctaw | 0.3 /100 | #290 | Tragic 1.4% |
| Blacks/African Americans | 0.3 /100 | #291 | Tragic 1.4% |
| Alaska Natives | 0.3 /100 | #292 | Tragic 1.4% |
| Immigrants | Yemen | 0.2 /100 | #293 | Tragic 1.4% |
| Samoans | 0.2 /100 | #294 | Tragic 1.4% |
| Guatemalans | 0.2 /100 | #295 | Tragic 1.4% |
| Immigrants | Ecuador | 0.2 /100 | #296 | Tragic 1.4% |
| Tsimshian | 0.2 /100 | #297 | Tragic 1.4% |
| Puerto Ricans | 0.1 /100 | #298 | Tragic 1.4% |
| Belizeans | 0.1 /100 | #299 | Tragic 1.4% |
| Immigrants | Guatemala | 0.1 /100 | #300 | Tragic 1.4% |
| Hondurans | 0.1 /100 | #301 | Tragic 1.4% |
| Shoshone | 0.1 /100 | #302 | Tragic 1.4% |
| Immigrants | Dominica | 0.1 /100 | #303 | Tragic 1.4% |