Immigrants from Belgium vs Croatian Professional Degree
COMPARE
Immigrants from Belgium
Croatian
Professional Degree
Professional Degree Comparison
Immigrants from Belgium
Croatians
7.0%
PROFESSIONAL DEGREE
100.0/ 100
METRIC RATING
10th/ 347
METRIC RANK
4.9%
PROFESSIONAL DEGREE
96.0/ 100
METRIC RATING
118th/ 347
METRIC RANK
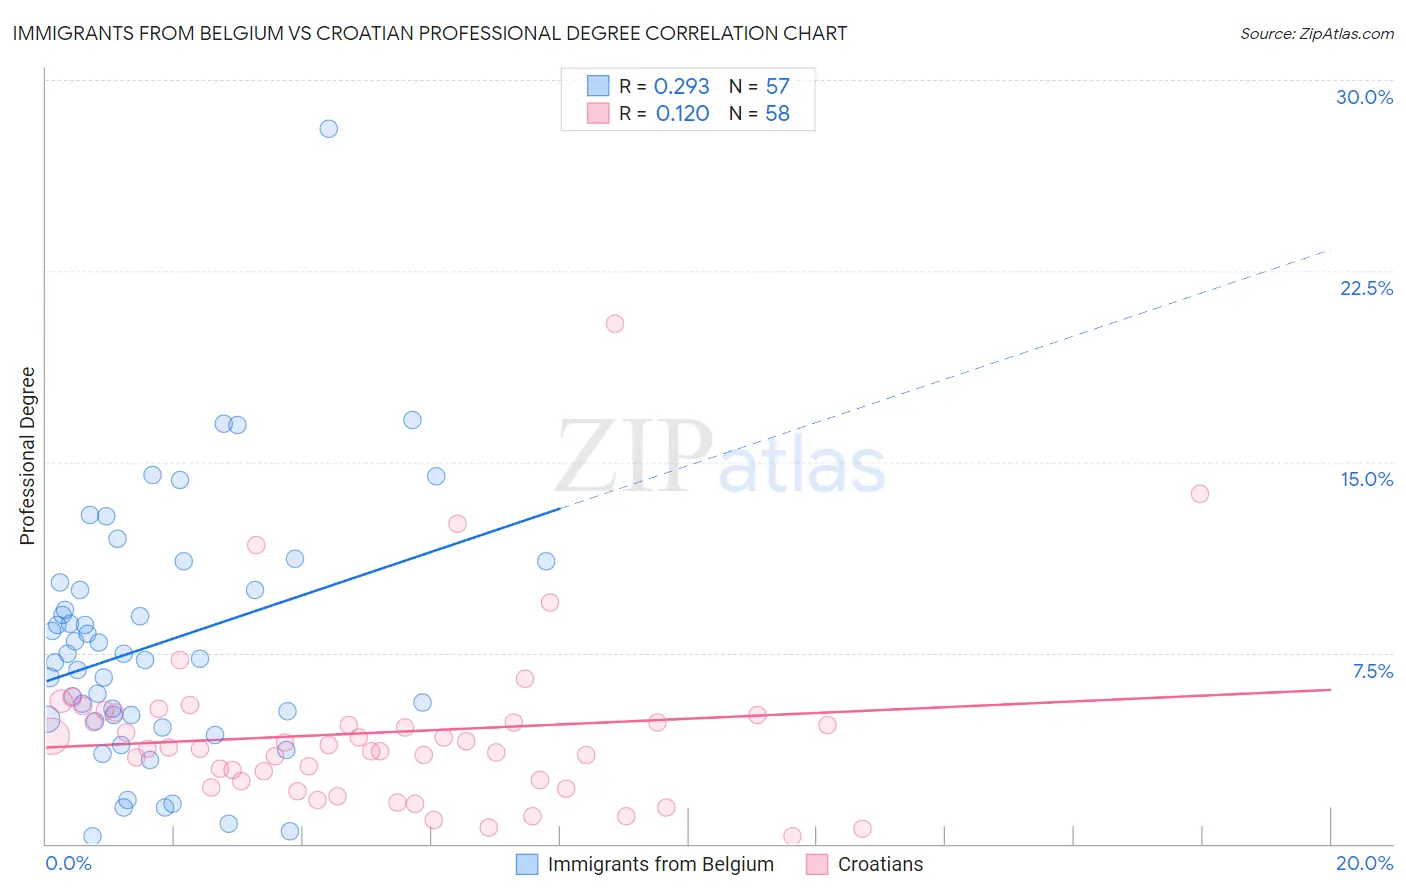
Immigrants from Belgium vs Croatian Professional Degree Correlation Chart
The statistical analysis conducted on geographies consisting of 146,639,976 people shows a weak positive correlation between the proportion of Immigrants from Belgium and percentage of population with at least professional degree education in the United States with a correlation coefficient (R) of 0.293 and weighted average of 7.0%. Similarly, the statistical analysis conducted on geographies consisting of 374,896,784 people shows a poor positive correlation between the proportion of Croatians and percentage of population with at least professional degree education in the United States with a correlation coefficient (R) of 0.120 and weighted average of 4.9%, a difference of 41.4%.
Professional Degree Correlation Summary
| Measurement | Immigrants from Belgium | Croatian |
| Minimum | 0.30% | 0.32% |
| Maximum | 28.1% | 20.4% |
| Range | 27.8% | 20.1% |
| Mean | 7.9% | 4.4% |
| Median | 7.3% | 3.8% |
| Interquartile 25% (IQ1) | 4.9% | 2.4% |
| Interquartile 75% (IQ3) | 10.1% | 5.0% |
| Interquartile Range (IQR) | 5.2% | 2.6% |
| Standard Deviation (Sample) | 5.0% | 3.4% |
| Standard Deviation (Population) | 4.9% | 3.4% |
Similar Demographics by Professional Degree
Demographics Similar to Immigrants from Belgium by Professional Degree
In terms of professional degree, the demographic groups most similar to Immigrants from Belgium are Cypriot (6.9%, a difference of 0.17%), Israeli (6.9%, a difference of 0.24%), Immigrants from Australia (6.9%, a difference of 0.66%), Immigrants from Taiwan (7.1%, a difference of 1.7%), and Immigrants from Switzerland (7.1%, a difference of 1.9%).
| Demographics | Rating | Rank | Professional Degree |
| Iranians | 100.0 /100 | #3 | Exceptional 7.6% |
| Filipinos | 100.0 /100 | #4 | Exceptional 7.6% |
| Immigrants | Iran | 100.0 /100 | #5 | Exceptional 7.3% |
| Okinawans | 100.0 /100 | #6 | Exceptional 7.3% |
| Eastern Europeans | 100.0 /100 | #7 | Exceptional 7.1% |
| Immigrants | Switzerland | 100.0 /100 | #8 | Exceptional 7.1% |
| Immigrants | Taiwan | 100.0 /100 | #9 | Exceptional 7.1% |
| Immigrants | Belgium | 100.0 /100 | #10 | Exceptional 7.0% |
| Cypriots | 100.0 /100 | #11 | Exceptional 6.9% |
| Israelis | 100.0 /100 | #12 | Exceptional 6.9% |
| Immigrants | Australia | 100.0 /100 | #13 | Exceptional 6.9% |
| Immigrants | France | 100.0 /100 | #14 | Exceptional 6.8% |
| Immigrants | China | 100.0 /100 | #15 | Exceptional 6.7% |
| Immigrants | Sweden | 100.0 /100 | #16 | Exceptional 6.7% |
| Immigrants | Eastern Asia | 100.0 /100 | #17 | Exceptional 6.6% |
Demographics Similar to Croatians by Professional Degree
In terms of professional degree, the demographic groups most similar to Croatians are Immigrants from Syria (4.9%, a difference of 0.0%), Venezuelan (4.9%, a difference of 0.21%), Immigrants from Sudan (4.9%, a difference of 0.54%), Albanian (4.9%, a difference of 0.55%), and Moroccan (5.0%, a difference of 0.68%).
| Demographics | Rating | Rank | Professional Degree |
| Brazilians | 97.4 /100 | #111 | Exceptional 5.0% |
| Taiwanese | 97.3 /100 | #112 | Exceptional 5.0% |
| Immigrants | Pakistan | 97.2 /100 | #113 | Exceptional 5.0% |
| Immigrants | Morocco | 96.8 /100 | #114 | Exceptional 5.0% |
| Moroccans | 96.8 /100 | #115 | Exceptional 5.0% |
| Venezuelans | 96.3 /100 | #116 | Exceptional 4.9% |
| Immigrants | Syria | 96.0 /100 | #117 | Exceptional 4.9% |
| Croatians | 96.0 /100 | #118 | Exceptional 4.9% |
| Immigrants | Sudan | 95.4 /100 | #119 | Exceptional 4.9% |
| Albanians | 95.3 /100 | #120 | Exceptional 4.9% |
| Immigrants | Moldova | 94.8 /100 | #121 | Exceptional 4.9% |
| Immigrants | Germany | 94.1 /100 | #122 | Exceptional 4.9% |
| Immigrants | Venezuela | 93.8 /100 | #123 | Exceptional 4.8% |
| Immigrants | Eritrea | 93.5 /100 | #124 | Exceptional 4.8% |
| Immigrants | Albania | 93.3 /100 | #125 | Exceptional 4.8% |