Black/African American vs Immigrants from Taiwan 2nd Grade
COMPARE
Black/African American
Immigrants from Taiwan
2nd Grade
2nd Grade Comparison
Blacks/African Americans
Immigrants from Taiwan
97.8%
2ND GRADE
29.9/ 100
METRIC RATING
192nd/ 347
METRIC RANK
97.8%
2ND GRADE
31.8/ 100
METRIC RATING
190th/ 347
METRIC RANK
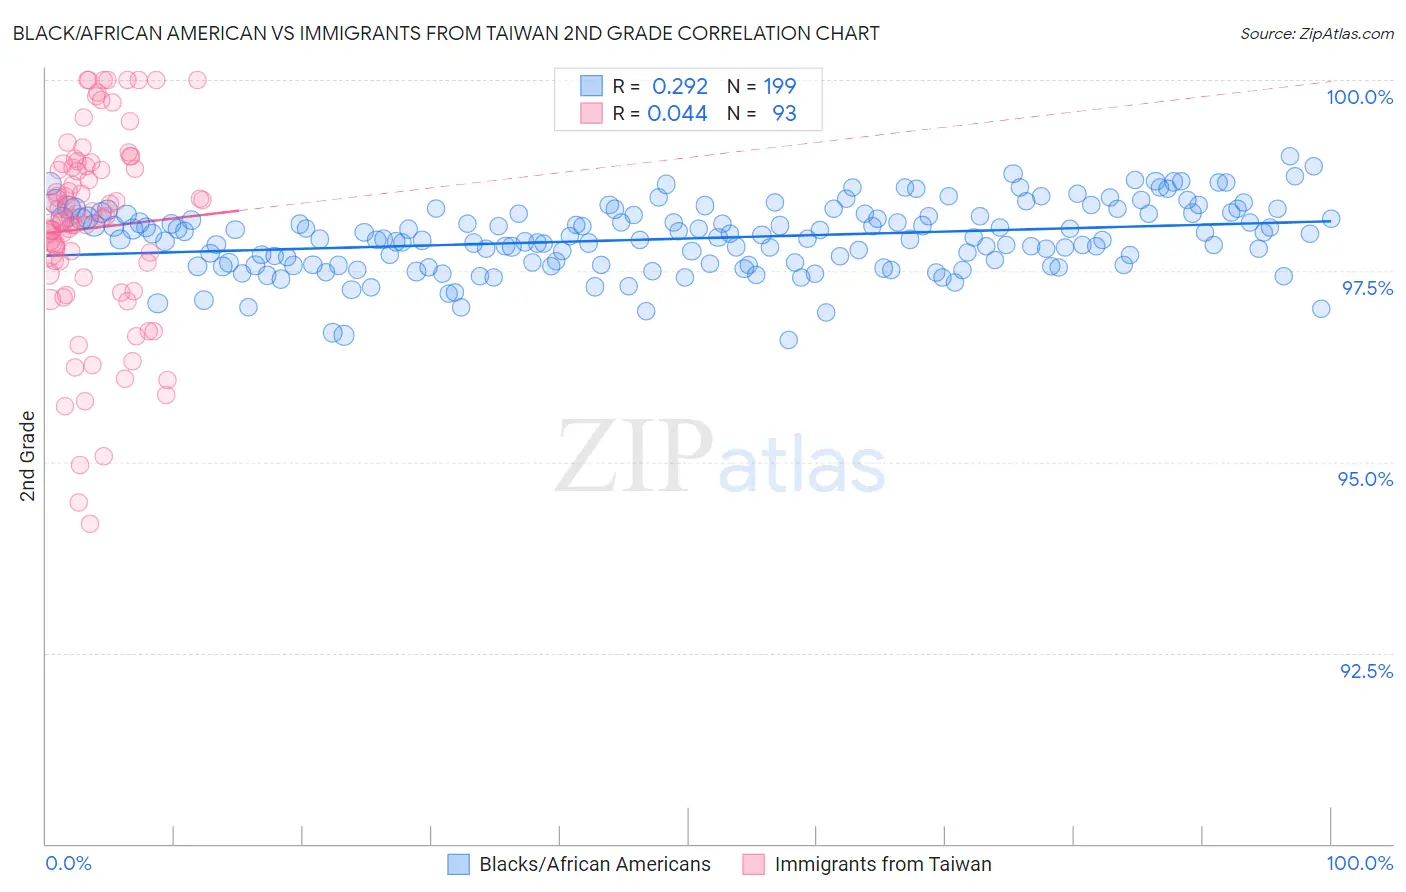
Black/African American vs Immigrants from Taiwan 2nd Grade Correlation Chart
The statistical analysis conducted on geographies consisting of 566,043,750 people shows a weak positive correlation between the proportion of Blacks/African Americans and percentage of population with at least 2nd grade education in the United States with a correlation coefficient (R) of 0.292 and weighted average of 97.8%. Similarly, the statistical analysis conducted on geographies consisting of 298,069,082 people shows no correlation between the proportion of Immigrants from Taiwan and percentage of population with at least 2nd grade education in the United States with a correlation coefficient (R) of 0.044 and weighted average of 97.8%, a difference of 0.010%.
2nd Grade Correlation Summary
| Measurement | Black/African American | Immigrants from Taiwan |
| Minimum | 96.6% | 94.2% |
| Maximum | 99.0% | 100.0% |
| Range | 2.4% | 5.8% |
| Mean | 97.9% | 98.1% |
| Median | 97.9% | 98.2% |
| Interquartile 25% (IQ1) | 97.6% | 97.4% |
| Interquartile 75% (IQ3) | 98.2% | 98.9% |
| Interquartile Range (IQR) | 0.66% | 1.4% |
| Standard Deviation (Sample) | 0.44% | 1.3% |
| Standard Deviation (Population) | 0.44% | 1.3% |
Demographics Similar to Blacks/African Americans and Immigrants from Taiwan by 2nd Grade
In terms of 2nd grade, the demographic groups most similar to Blacks/African Americans are Paraguayan (97.8%, a difference of 0.0%), Panamanian (97.8%, a difference of 0.010%), Hawaiian (97.8%, a difference of 0.010%), Paiute (97.8%, a difference of 0.010%), and Mongolian (97.8%, a difference of 0.010%). Similarly, the demographic groups most similar to Immigrants from Taiwan are Paraguayan (97.8%, a difference of 0.0%), Immigrants from Kazakhstan (97.8%, a difference of 0.010%), Panamanian (97.8%, a difference of 0.010%), Hawaiian (97.8%, a difference of 0.010%), and Arab (97.8%, a difference of 0.020%).
| Demographics | Rating | Rank | 2nd Grade |
| Egyptians | 44.3 /100 | #181 | Average 97.9% |
| Portuguese | 42.4 /100 | #182 | Average 97.8% |
| Immigrants | Poland | 42.2 /100 | #183 | Average 97.8% |
| Immigrants | Belarus | 41.5 /100 | #184 | Average 97.8% |
| Immigrants | Argentina | 40.6 /100 | #185 | Average 97.8% |
| Arabs | 36.9 /100 | #186 | Fair 97.8% |
| Pakistanis | 36.1 /100 | #187 | Fair 97.8% |
| Immigrants | Kazakhstan | 35.6 /100 | #188 | Fair 97.8% |
| Panamanians | 33.5 /100 | #189 | Fair 97.8% |
| Immigrants | Taiwan | 31.8 /100 | #190 | Fair 97.8% |
| Paraguayans | 30.8 /100 | #191 | Fair 97.8% |
| Blacks/African Americans | 29.9 /100 | #192 | Fair 97.8% |
| Hawaiians | 28.5 /100 | #193 | Fair 97.8% |
| Paiute | 27.0 /100 | #194 | Fair 97.8% |
| Mongolians | 26.7 /100 | #195 | Fair 97.8% |
| Immigrants | Kenya | 26.4 /100 | #196 | Fair 97.8% |
| Immigrants | Uganda | 26.3 /100 | #197 | Fair 97.8% |
| Guamanians/Chamorros | 25.7 /100 | #198 | Fair 97.8% |
| Immigrants | Egypt | 24.4 /100 | #199 | Fair 97.8% |
| Immigrants | Lebanon | 20.9 /100 | #200 | Fair 97.8% |
| Tohono O'odham | 20.9 /100 | #201 | Fair 97.8% |