Basque vs Immigrants from Eritrea 2nd Grade
COMPARE
Basque
Immigrants from Eritrea
2nd Grade
2nd Grade Comparison
Basques
Immigrants from Eritrea
98.1%
2ND GRADE
97.2/ 100
METRIC RATING
109th/ 347
METRIC RANK
97.2%
2ND GRADE
0.0/ 100
METRIC RATING
292nd/ 347
METRIC RANK
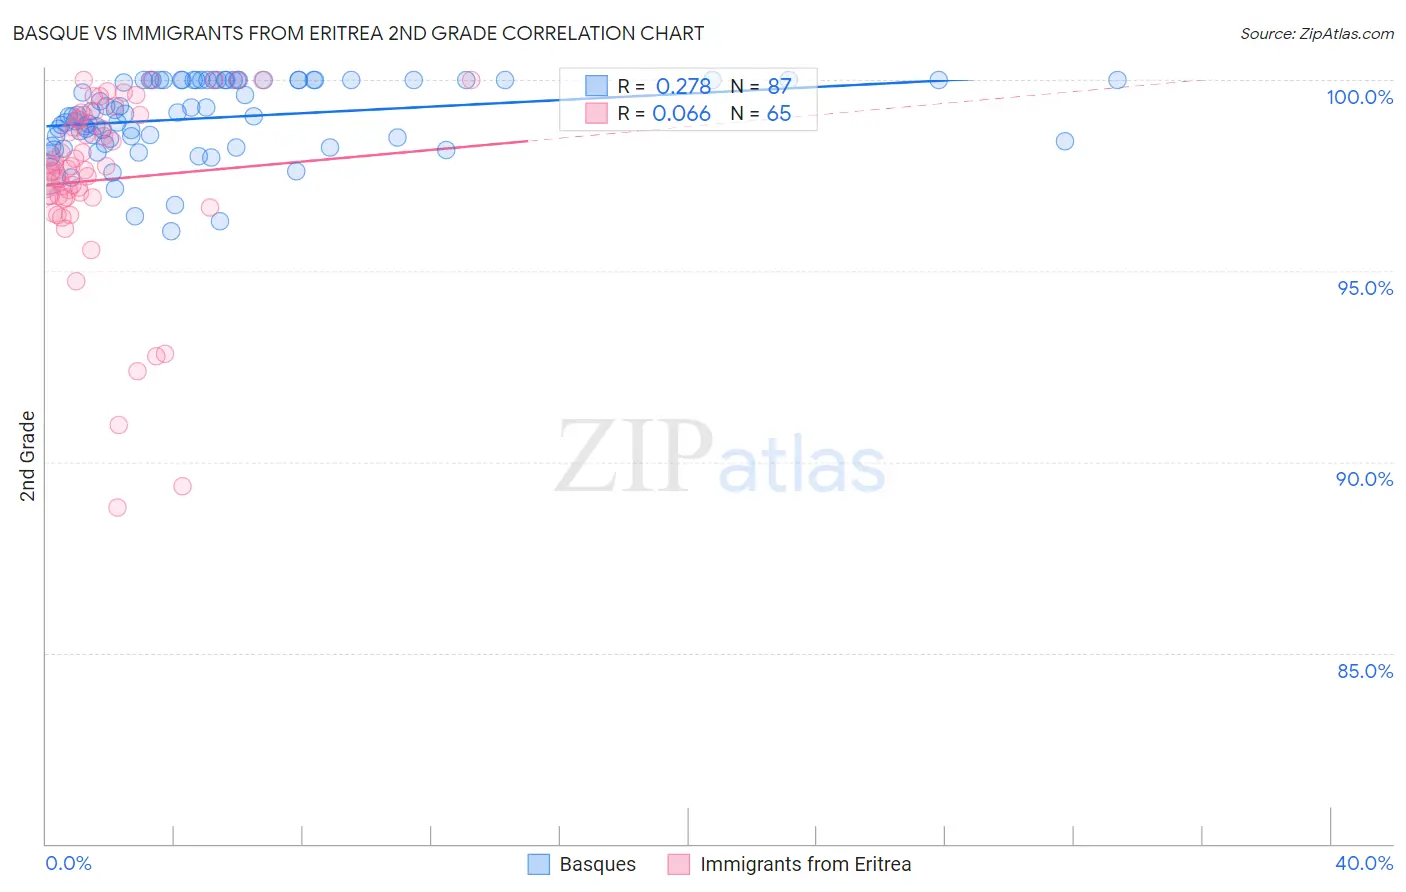
Basque vs Immigrants from Eritrea 2nd Grade Correlation Chart
The statistical analysis conducted on geographies consisting of 165,774,137 people shows a weak positive correlation between the proportion of Basques and percentage of population with at least 2nd grade education in the United States with a correlation coefficient (R) of 0.278 and weighted average of 98.1%. Similarly, the statistical analysis conducted on geographies consisting of 104,801,381 people shows a slight positive correlation between the proportion of Immigrants from Eritrea and percentage of population with at least 2nd grade education in the United States with a correlation coefficient (R) of 0.066 and weighted average of 97.2%, a difference of 1.0%.
2nd Grade Correlation Summary
| Measurement | Basque | Immigrants from Eritrea |
| Minimum | 96.0% | 88.8% |
| Maximum | 100.0% | 100.0% |
| Range | 4.0% | 11.2% |
| Mean | 99.0% | 97.4% |
| Median | 99.1% | 97.7% |
| Interquartile 25% (IQ1) | 98.4% | 96.9% |
| Interquartile 75% (IQ3) | 100.0% | 99.0% |
| Interquartile Range (IQR) | 1.6% | 2.1% |
| Standard Deviation (Sample) | 0.99% | 2.4% |
| Standard Deviation (Population) | 0.98% | 2.4% |
Similar Demographics by 2nd Grade
Demographics Similar to Basques by 2nd Grade
In terms of 2nd grade, the demographic groups most similar to Basques are Immigrants from Switzerland (98.1%, a difference of 0.0%), Pima (98.2%, a difference of 0.010%), Turkish (98.2%, a difference of 0.010%), Yugoslavian (98.2%, a difference of 0.010%), and Bhutanese (98.1%, a difference of 0.010%).
| Demographics | Rating | Rank | 2nd Grade |
| Cree | 98.0 /100 | #102 | Exceptional 98.2% |
| Pima | 97.6 /100 | #103 | Exceptional 98.2% |
| Turks | 97.6 /100 | #104 | Exceptional 98.2% |
| Yugoslavians | 97.5 /100 | #105 | Exceptional 98.2% |
| Bhutanese | 97.5 /100 | #106 | Exceptional 98.1% |
| German Russians | 97.4 /100 | #107 | Exceptional 98.1% |
| Immigrants | Switzerland | 97.3 /100 | #108 | Exceptional 98.1% |
| Basques | 97.2 /100 | #109 | Exceptional 98.1% |
| Immigrants | Singapore | 97.0 /100 | #110 | Exceptional 98.1% |
| Immigrants | Czechoslovakia | 96.9 /100 | #111 | Exceptional 98.1% |
| Colville | 96.6 /100 | #112 | Exceptional 98.1% |
| Immigrants | Norway | 96.5 /100 | #113 | Exceptional 98.1% |
| Immigrants | Latvia | 96.4 /100 | #114 | Exceptional 98.1% |
| Iranians | 95.9 /100 | #115 | Exceptional 98.1% |
| Spanish | 95.8 /100 | #116 | Exceptional 98.1% |
Demographics Similar to Immigrants from Eritrea by 2nd Grade
In terms of 2nd grade, the demographic groups most similar to Immigrants from Eritrea are British West Indian (97.2%, a difference of 0.010%), Immigrants from Afghanistan (97.2%, a difference of 0.020%), Houma (97.2%, a difference of 0.030%), Immigrants from St. Vincent and the Grenadines (97.2%, a difference of 0.030%), and Malaysian (97.1%, a difference of 0.040%).
| Demographics | Rating | Rank | 2nd Grade |
| Immigrants | Hong Kong | 0.0 /100 | #285 | Tragic 97.2% |
| Immigrants | Barbados | 0.0 /100 | #286 | Tragic 97.2% |
| Immigrants | Portugal | 0.0 /100 | #287 | Tragic 97.2% |
| Immigrants | Thailand | 0.0 /100 | #288 | Tragic 97.2% |
| Houma | 0.0 /100 | #289 | Tragic 97.2% |
| Immigrants | St. Vincent and the Grenadines | 0.0 /100 | #290 | Tragic 97.2% |
| Immigrants | Afghanistan | 0.0 /100 | #291 | Tragic 97.2% |
| Immigrants | Eritrea | 0.0 /100 | #292 | Tragic 97.2% |
| British West Indians | 0.0 /100 | #293 | Tragic 97.2% |
| Malaysians | 0.0 /100 | #294 | Tragic 97.1% |
| Immigrants | Grenada | 0.0 /100 | #295 | Tragic 97.1% |
| Immigrants | Immigrants | 0.0 /100 | #296 | Tragic 97.1% |
| Immigrants | Cuba | 0.0 /100 | #297 | Tragic 97.0% |
| Immigrants | Dominica | 0.0 /100 | #298 | Tragic 97.0% |
| Haitians | 0.0 /100 | #299 | Tragic 97.0% |