Black/African American vs Samoan Master's Degree
COMPARE
Black/African American
Samoan
Master's Degree
Master's Degree Comparison
Blacks/African Americans
Samoans
12.1%
MASTER'S DEGREE
0.3/ 100
METRIC RATING
276th/ 347
METRIC RANK
11.5%
MASTER'S DEGREE
0.1/ 100
METRIC RATING
298th/ 347
METRIC RANK
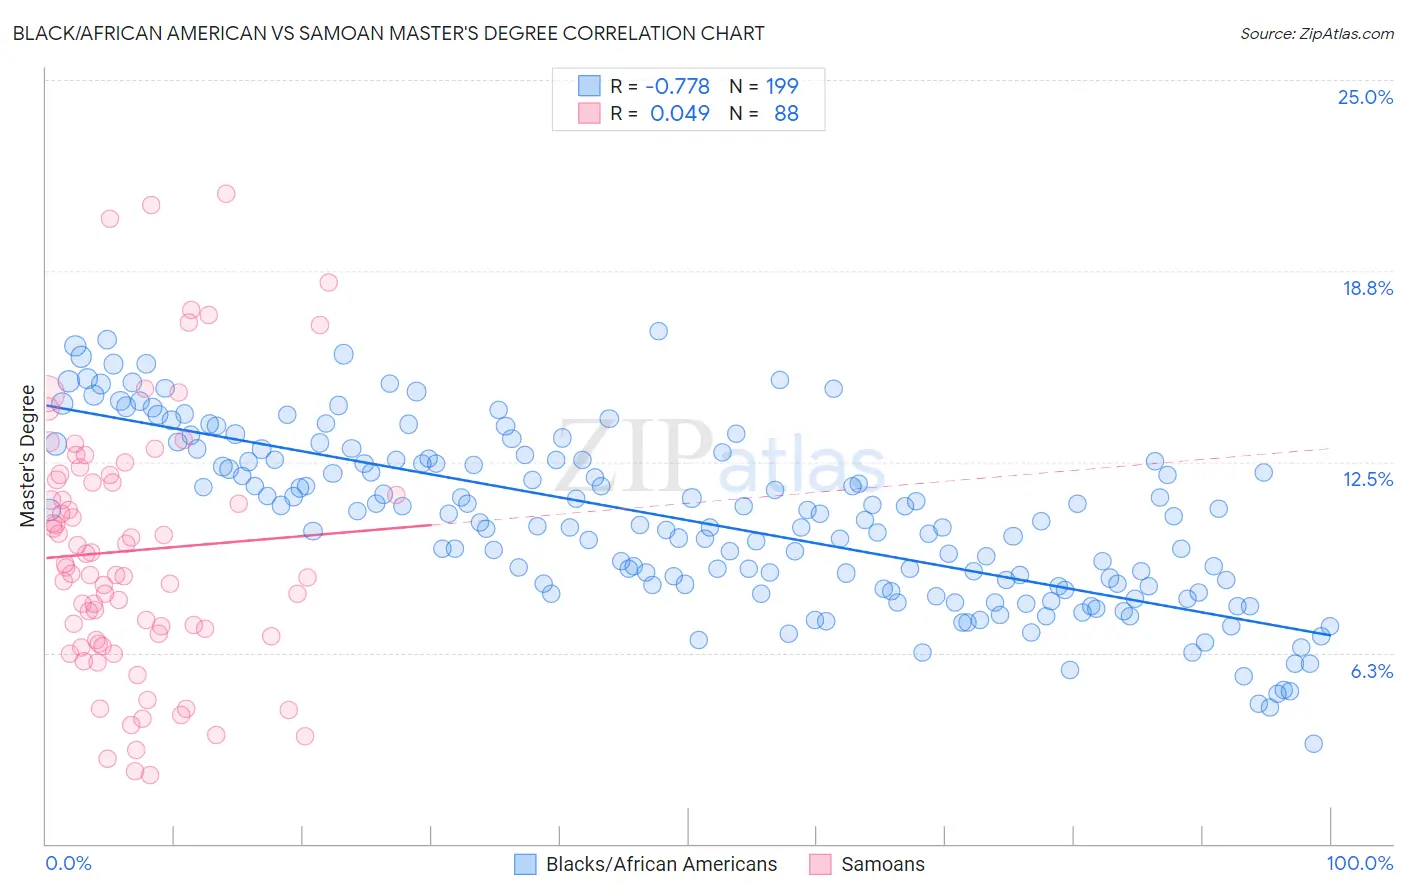
Black/African American vs Samoan Master's Degree Correlation Chart
The statistical analysis conducted on geographies consisting of 563,961,779 people shows a strong negative correlation between the proportion of Blacks/African Americans and percentage of population with at least master's degree education in the United States with a correlation coefficient (R) of -0.778 and weighted average of 12.1%. Similarly, the statistical analysis conducted on geographies consisting of 225,135,673 people shows no correlation between the proportion of Samoans and percentage of population with at least master's degree education in the United States with a correlation coefficient (R) of 0.049 and weighted average of 11.5%, a difference of 5.2%.
Master's Degree Correlation Summary
| Measurement | Black/African American | Samoan |
| Minimum | 3.3% | 2.3% |
| Maximum | 16.8% | 21.3% |
| Range | 13.5% | 19.0% |
| Mean | 10.6% | 9.6% |
| Median | 10.6% | 8.9% |
| Interquartile 25% (IQ1) | 8.4% | 6.7% |
| Interquartile 75% (IQ3) | 12.6% | 12.0% |
| Interquartile Range (IQR) | 4.1% | 5.3% |
| Standard Deviation (Sample) | 2.8% | 4.2% |
| Standard Deviation (Population) | 2.8% | 4.2% |
Similar Demographics by Master's Degree
Demographics Similar to Blacks/African Americans by Master's Degree
In terms of master's degree, the demographic groups most similar to Blacks/African Americans are Immigrants from Caribbean (12.1%, a difference of 0.010%), Potawatomi (12.1%, a difference of 0.010%), Cuban (12.1%, a difference of 0.050%), Cape Verdean (12.1%, a difference of 0.070%), and Immigrants from Belize (12.1%, a difference of 0.090%).
| Demographics | Rating | Rank | Master's Degree |
| Central Americans | 0.3 /100 | #269 | Tragic 12.2% |
| Salvadorans | 0.3 /100 | #270 | Tragic 12.2% |
| Haitians | 0.3 /100 | #271 | Tragic 12.1% |
| Comanche | 0.3 /100 | #272 | Tragic 12.1% |
| Blackfeet | 0.3 /100 | #273 | Tragic 12.1% |
| Cape Verdeans | 0.3 /100 | #274 | Tragic 12.1% |
| Cubans | 0.3 /100 | #275 | Tragic 12.1% |
| Blacks/African Americans | 0.3 /100 | #276 | Tragic 12.1% |
| Immigrants | Caribbean | 0.3 /100 | #277 | Tragic 12.1% |
| Potawatomi | 0.3 /100 | #278 | Tragic 12.1% |
| Immigrants | Belize | 0.2 /100 | #279 | Tragic 12.1% |
| Immigrants | Dominican Republic | 0.2 /100 | #280 | Tragic 12.1% |
| Malaysians | 0.2 /100 | #281 | Tragic 12.0% |
| Immigrants | El Salvador | 0.2 /100 | #282 | Tragic 12.0% |
| Hondurans | 0.2 /100 | #283 | Tragic 11.9% |
Demographics Similar to Samoans by Master's Degree
In terms of master's degree, the demographic groups most similar to Samoans are Chickasaw (11.4%, a difference of 0.46%), Chippewa (11.4%, a difference of 0.48%), Tsimshian (11.4%, a difference of 0.64%), Immigrants from Yemen (11.6%, a difference of 0.71%), and Marshallese (11.6%, a difference of 0.84%).
| Demographics | Rating | Rank | Master's Degree |
| Colville | 0.1 /100 | #291 | Tragic 11.6% |
| Immigrants | Guatemala | 0.1 /100 | #292 | Tragic 11.6% |
| Alaska Natives | 0.1 /100 | #293 | Tragic 11.6% |
| Hawaiians | 0.1 /100 | #294 | Tragic 11.6% |
| Marshallese | 0.1 /100 | #295 | Tragic 11.6% |
| Alaskan Athabascans | 0.1 /100 | #296 | Tragic 11.6% |
| Immigrants | Yemen | 0.1 /100 | #297 | Tragic 11.6% |
| Samoans | 0.1 /100 | #298 | Tragic 11.5% |
| Chickasaw | 0.1 /100 | #299 | Tragic 11.4% |
| Chippewa | 0.1 /100 | #300 | Tragic 11.4% |
| Tsimshian | 0.1 /100 | #301 | Tragic 11.4% |
| Cherokee | 0.1 /100 | #302 | Tragic 11.4% |
| Immigrants | Laos | 0.1 /100 | #303 | Tragic 11.4% |
| Immigrants | Cabo Verde | 0.1 /100 | #304 | Tragic 11.3% |
| Immigrants | Latin America | 0.0 /100 | #305 | Tragic 11.3% |