Blackfeet vs Immigrants from Portugal College, 1 year or more
COMPARE
Blackfeet
Immigrants from Portugal
College, 1 year or more
College, 1 year or more Comparison
Blackfeet
Immigrants from Portugal
54.6%
COLLEGE, 1 YEAR OR MORE
0.2/ 100
METRIC RATING
267th/ 347
METRIC RANK
51.9%
COLLEGE, 1 YEAR OR MORE
0.0/ 100
METRIC RATING
307th/ 347
METRIC RANK
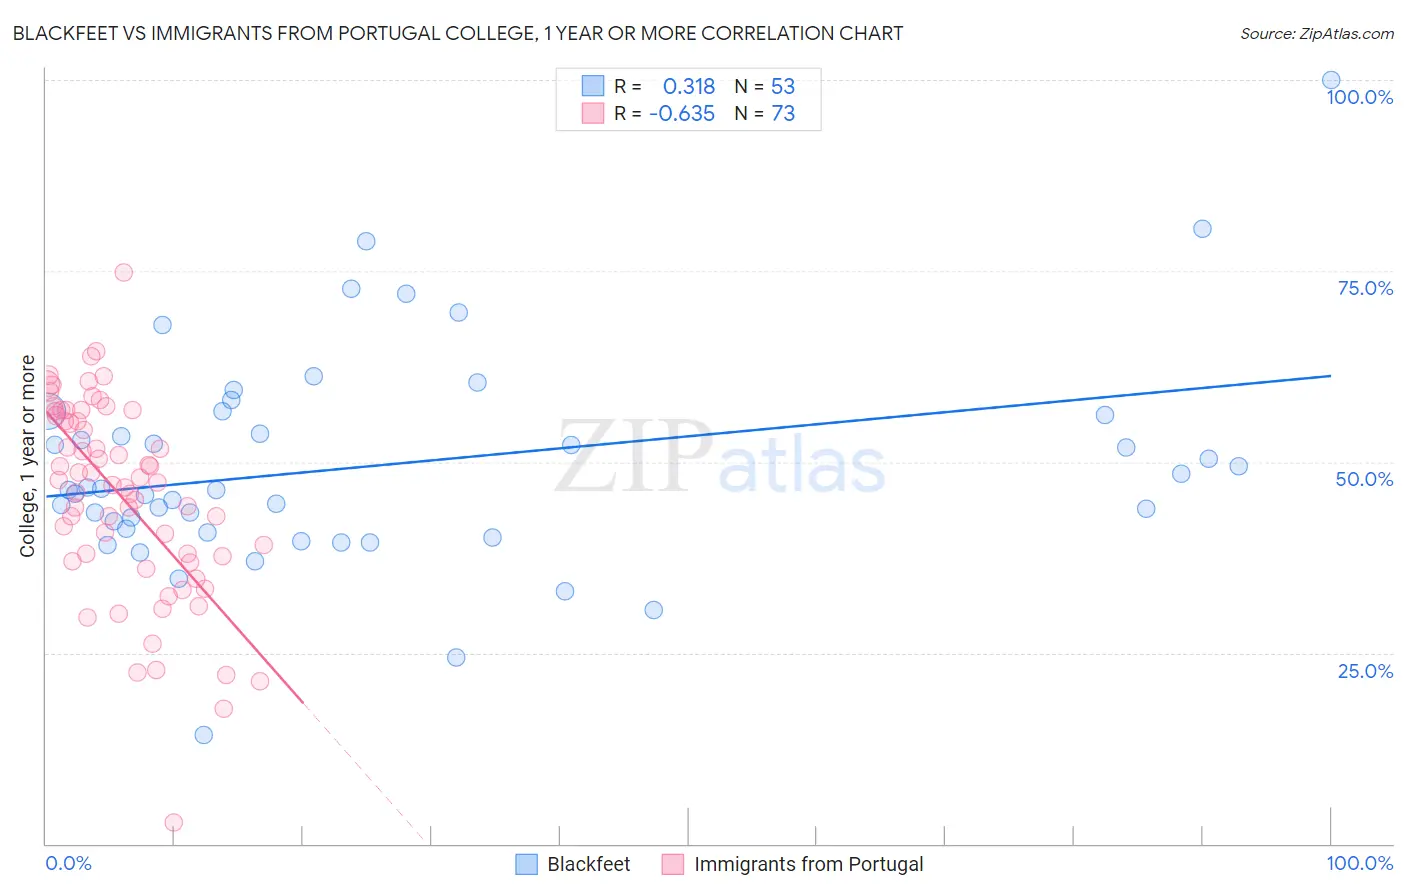
Blackfeet vs Immigrants from Portugal College, 1 year or more Correlation Chart
The statistical analysis conducted on geographies consisting of 309,581,710 people shows a mild positive correlation between the proportion of Blackfeet and percentage of population with at least college, 1 year or more education in the United States with a correlation coefficient (R) of 0.318 and weighted average of 54.6%. Similarly, the statistical analysis conducted on geographies consisting of 174,792,609 people shows a significant negative correlation between the proportion of Immigrants from Portugal and percentage of population with at least college, 1 year or more education in the United States with a correlation coefficient (R) of -0.635 and weighted average of 51.9%, a difference of 5.3%.
College, 1 year or more Correlation Summary
| Measurement | Blackfeet | Immigrants from Portugal |
| Minimum | 14.2% | 2.8% |
| Maximum | 100.0% | 74.9% |
| Range | 85.8% | 72.1% |
| Mean | 49.6% | 45.5% |
| Median | 46.3% | 47.3% |
| Interquartile 25% (IQ1) | 40.9% | 37.3% |
| Interquartile 75% (IQ3) | 56.4% | 56.3% |
| Interquartile Range (IQR) | 15.4% | 19.0% |
| Standard Deviation (Sample) | 14.4% | 13.0% |
| Standard Deviation (Population) | 14.3% | 12.9% |
Similar Demographics by College, 1 year or more
Demographics Similar to Blackfeet by College, 1 year or more
In terms of college, 1 year or more, the demographic groups most similar to Blackfeet are Potawatomi (54.6%, a difference of 0.070%), Immigrants from Laos (54.7%, a difference of 0.12%), British West Indian (54.5%, a difference of 0.16%), Bangladeshi (54.5%, a difference of 0.19%), and Crow (54.5%, a difference of 0.22%).
| Demographics | Rating | Rank | College, 1 year or more |
| Jamaicans | 0.3 /100 | #260 | Tragic 54.9% |
| Ottawa | 0.3 /100 | #261 | Tragic 54.9% |
| Immigrants | St. Vincent and the Grenadines | 0.3 /100 | #262 | Tragic 54.8% |
| U.S. Virgin Islanders | 0.3 /100 | #263 | Tragic 54.8% |
| Immigrants | Micronesia | 0.3 /100 | #264 | Tragic 54.8% |
| Immigrants | Laos | 0.2 /100 | #265 | Tragic 54.7% |
| Potawatomi | 0.2 /100 | #266 | Tragic 54.6% |
| Blackfeet | 0.2 /100 | #267 | Tragic 54.6% |
| British West Indians | 0.2 /100 | #268 | Tragic 54.5% |
| Bangladeshis | 0.2 /100 | #269 | Tragic 54.5% |
| Crow | 0.2 /100 | #270 | Tragic 54.5% |
| Bahamians | 0.2 /100 | #271 | Tragic 54.5% |
| Comanche | 0.2 /100 | #272 | Tragic 54.4% |
| Immigrants | Grenada | 0.2 /100 | #273 | Tragic 54.4% |
| Belizeans | 0.2 /100 | #274 | Tragic 54.4% |
Demographics Similar to Immigrants from Portugal by College, 1 year or more
In terms of college, 1 year or more, the demographic groups most similar to Immigrants from Portugal are Mexican American Indian (51.9%, a difference of 0.10%), Salvadoran (51.8%, a difference of 0.10%), Apache (51.8%, a difference of 0.11%), Seminole (52.1%, a difference of 0.44%), and Honduran (51.6%, a difference of 0.50%).
| Demographics | Rating | Rank | College, 1 year or more |
| Choctaw | 0.0 /100 | #300 | Tragic 52.3% |
| Haitians | 0.0 /100 | #301 | Tragic 52.3% |
| Puerto Ricans | 0.0 /100 | #302 | Tragic 52.2% |
| Creek | 0.0 /100 | #303 | Tragic 52.2% |
| Central Americans | 0.0 /100 | #304 | Tragic 52.1% |
| Seminole | 0.0 /100 | #305 | Tragic 52.1% |
| Mexican American Indians | 0.0 /100 | #306 | Tragic 51.9% |
| Immigrants | Portugal | 0.0 /100 | #307 | Tragic 51.9% |
| Salvadorans | 0.0 /100 | #308 | Tragic 51.8% |
| Apache | 0.0 /100 | #309 | Tragic 51.8% |
| Hondurans | 0.0 /100 | #310 | Tragic 51.6% |
| Immigrants | Haiti | 0.0 /100 | #311 | Tragic 51.5% |
| Pueblo | 0.0 /100 | #312 | Tragic 51.5% |
| Immigrants | Caribbean | 0.0 /100 | #313 | Tragic 51.4% |
| Fijians | 0.0 /100 | #314 | Tragic 51.3% |