Vietnamese vs Immigrants from Portugal College, 1 year or more
COMPARE
Vietnamese
Immigrants from Portugal
College, 1 year or more
College, 1 year or more Comparison
Vietnamese
Immigrants from Portugal
57.0%
COLLEGE, 1 YEAR OR MORE
4.7/ 100
METRIC RATING
225th/ 347
METRIC RANK
51.9%
COLLEGE, 1 YEAR OR MORE
0.0/ 100
METRIC RATING
307th/ 347
METRIC RANK
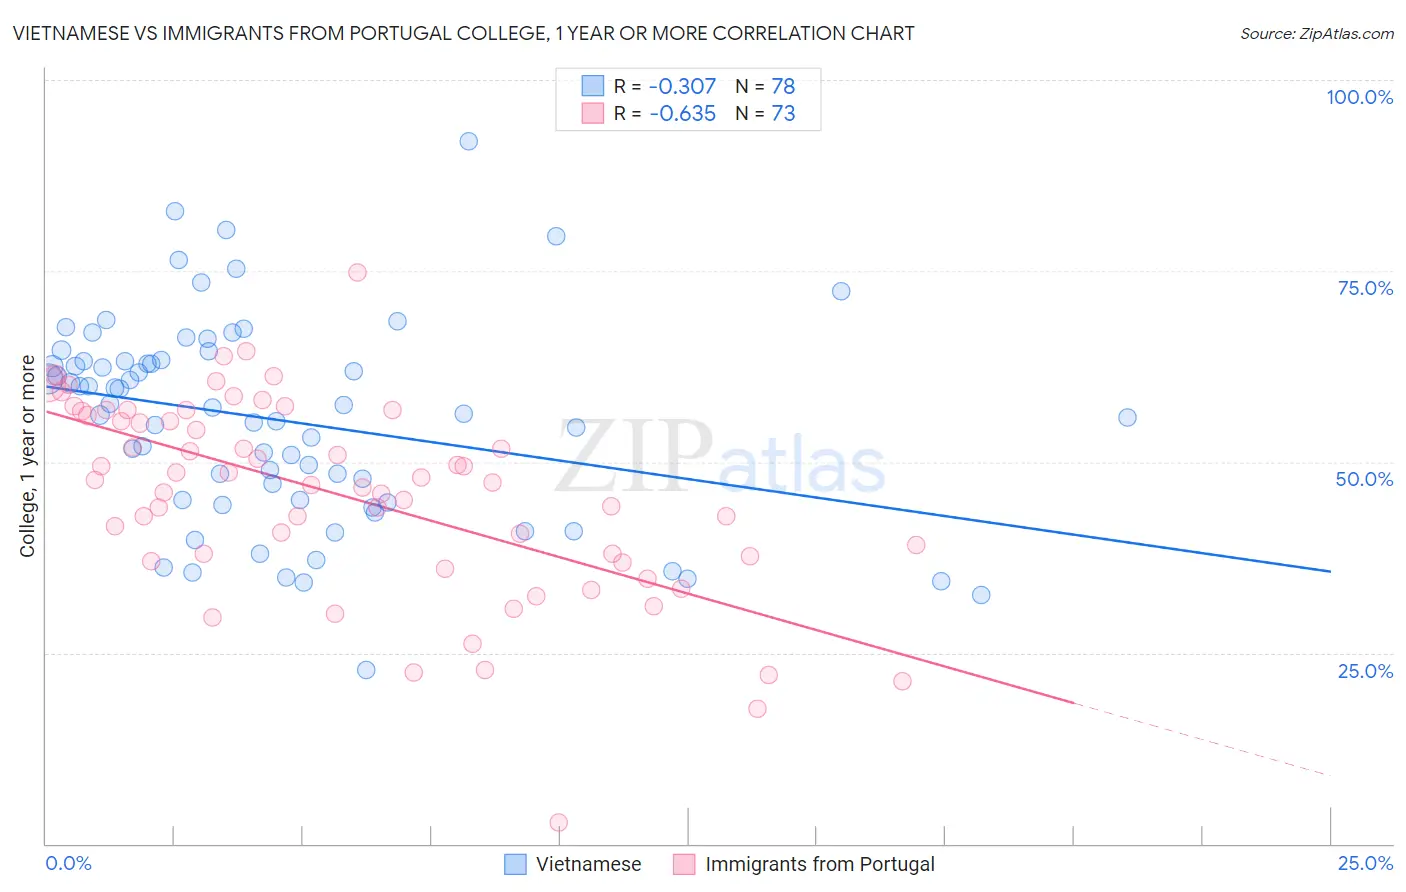
Vietnamese vs Immigrants from Portugal College, 1 year or more Correlation Chart
The statistical analysis conducted on geographies consisting of 170,751,543 people shows a mild negative correlation between the proportion of Vietnamese and percentage of population with at least college, 1 year or more education in the United States with a correlation coefficient (R) of -0.307 and weighted average of 57.0%. Similarly, the statistical analysis conducted on geographies consisting of 174,792,609 people shows a significant negative correlation between the proportion of Immigrants from Portugal and percentage of population with at least college, 1 year or more education in the United States with a correlation coefficient (R) of -0.635 and weighted average of 51.9%, a difference of 10.0%.
College, 1 year or more Correlation Summary
| Measurement | Vietnamese | Immigrants from Portugal |
| Minimum | 22.8% | 2.8% |
| Maximum | 92.0% | 74.9% |
| Range | 69.3% | 72.1% |
| Mean | 55.4% | 45.5% |
| Median | 56.7% | 47.3% |
| Interquartile 25% (IQ1) | 45.0% | 37.3% |
| Interquartile 75% (IQ3) | 63.2% | 56.3% |
| Interquartile Range (IQR) | 18.3% | 19.0% |
| Standard Deviation (Sample) | 13.4% | 13.0% |
| Standard Deviation (Population) | 13.3% | 12.9% |
Similar Demographics by College, 1 year or more
Demographics Similar to Vietnamese by College, 1 year or more
In terms of college, 1 year or more, the demographic groups most similar to Vietnamese are Immigrants from Western Africa (57.0%, a difference of 0.030%), Immigrants (57.0%, a difference of 0.090%), Portuguese (57.2%, a difference of 0.21%), Hmong (57.2%, a difference of 0.21%), and Immigrants from Fiji (56.9%, a difference of 0.24%).
| Demographics | Rating | Rank | College, 1 year or more |
| Native Hawaiians | 9.0 /100 | #218 | Tragic 57.6% |
| Whites/Caucasians | 8.7 /100 | #219 | Tragic 57.6% |
| Immigrants | Costa Rica | 8.0 /100 | #220 | Tragic 57.5% |
| Immigrants | Ghana | 7.7 /100 | #221 | Tragic 57.4% |
| Sub-Saharan Africans | 6.1 /100 | #222 | Tragic 57.3% |
| Portuguese | 5.4 /100 | #223 | Tragic 57.2% |
| Hmong | 5.4 /100 | #224 | Tragic 57.2% |
| Vietnamese | 4.7 /100 | #225 | Tragic 57.0% |
| Immigrants | Western Africa | 4.6 /100 | #226 | Tragic 57.0% |
| Immigrants | Immigrants | 4.4 /100 | #227 | Tragic 57.0% |
| Immigrants | Fiji | 4.0 /100 | #228 | Tragic 56.9% |
| Cree | 3.6 /100 | #229 | Tragic 56.8% |
| Liberians | 3.1 /100 | #230 | Tragic 56.7% |
| Immigrants | Burma/Myanmar | 2.7 /100 | #231 | Tragic 56.6% |
| Immigrants | Bangladesh | 2.6 /100 | #232 | Tragic 56.6% |
Demographics Similar to Immigrants from Portugal by College, 1 year or more
In terms of college, 1 year or more, the demographic groups most similar to Immigrants from Portugal are Mexican American Indian (51.9%, a difference of 0.10%), Salvadoran (51.8%, a difference of 0.10%), Apache (51.8%, a difference of 0.11%), Seminole (52.1%, a difference of 0.44%), and Honduran (51.6%, a difference of 0.50%).
| Demographics | Rating | Rank | College, 1 year or more |
| Choctaw | 0.0 /100 | #300 | Tragic 52.3% |
| Haitians | 0.0 /100 | #301 | Tragic 52.3% |
| Puerto Ricans | 0.0 /100 | #302 | Tragic 52.2% |
| Creek | 0.0 /100 | #303 | Tragic 52.2% |
| Central Americans | 0.0 /100 | #304 | Tragic 52.1% |
| Seminole | 0.0 /100 | #305 | Tragic 52.1% |
| Mexican American Indians | 0.0 /100 | #306 | Tragic 51.9% |
| Immigrants | Portugal | 0.0 /100 | #307 | Tragic 51.9% |
| Salvadorans | 0.0 /100 | #308 | Tragic 51.8% |
| Apache | 0.0 /100 | #309 | Tragic 51.8% |
| Hondurans | 0.0 /100 | #310 | Tragic 51.6% |
| Immigrants | Haiti | 0.0 /100 | #311 | Tragic 51.5% |
| Pueblo | 0.0 /100 | #312 | Tragic 51.5% |
| Immigrants | Caribbean | 0.0 /100 | #313 | Tragic 51.4% |
| Fijians | 0.0 /100 | #314 | Tragic 51.3% |