Blackfeet vs Immigrants from Portugal 11th Grade
COMPARE
Blackfeet
Immigrants from Portugal
11th Grade
11th Grade Comparison
Blackfeet
Immigrants from Portugal
92.0%
11TH GRADE
10.1/ 100
METRIC RATING
218th/ 347
METRIC RANK
89.3%
11TH GRADE
0.0/ 100
METRIC RATING
312th/ 347
METRIC RANK
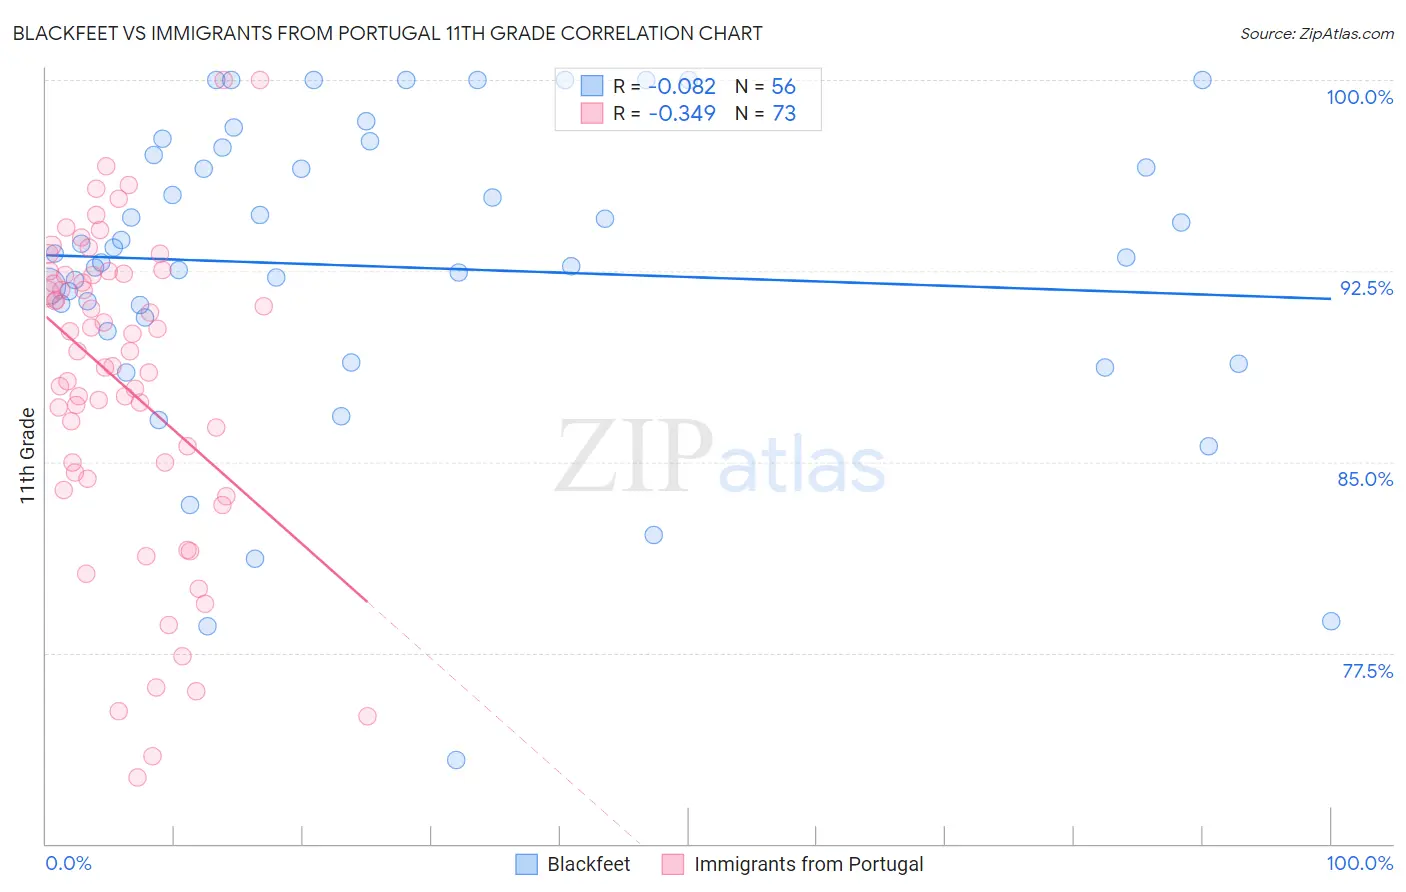
Blackfeet vs Immigrants from Portugal 11th Grade Correlation Chart
The statistical analysis conducted on geographies consisting of 309,582,133 people shows a slight negative correlation between the proportion of Blackfeet and percentage of population with at least 11th grade education in the United States with a correlation coefficient (R) of -0.082 and weighted average of 92.0%. Similarly, the statistical analysis conducted on geographies consisting of 174,792,107 people shows a mild negative correlation between the proportion of Immigrants from Portugal and percentage of population with at least 11th grade education in the United States with a correlation coefficient (R) of -0.349 and weighted average of 89.3%, a difference of 3.1%.
11th Grade Correlation Summary
| Measurement | Blackfeet | Immigrants from Portugal |
| Minimum | 73.3% | 72.6% |
| Maximum | 100.0% | 100.0% |
| Range | 26.7% | 27.4% |
| Mean | 92.7% | 88.0% |
| Median | 93.1% | 89.3% |
| Interquartile 25% (IQ1) | 90.4% | 84.4% |
| Interquartile 75% (IQ3) | 97.2% | 92.4% |
| Interquartile Range (IQR) | 6.8% | 7.9% |
| Standard Deviation (Sample) | 6.1% | 6.2% |
| Standard Deviation (Population) | 6.0% | 6.2% |
Similar Demographics by 11th Grade
Demographics Similar to Blackfeet by 11th Grade
In terms of 11th grade, the demographic groups most similar to Blackfeet are Portuguese (92.0%, a difference of 0.0%), Immigrants from Sierra Leone (92.0%, a difference of 0.030%), Somali (92.1%, a difference of 0.040%), Immigrants from Southern Europe (92.1%, a difference of 0.060%), and Afghan (92.1%, a difference of 0.070%).
| Demographics | Rating | Rank | 11th Grade |
| Immigrants | Micronesia | 17.7 /100 | #211 | Poor 92.2% |
| Koreans | 14.4 /100 | #212 | Poor 92.1% |
| Immigrants | Ethiopia | 13.9 /100 | #213 | Poor 92.1% |
| Afghans | 12.8 /100 | #214 | Poor 92.1% |
| Immigrants | Southern Europe | 12.5 /100 | #215 | Poor 92.1% |
| Somalis | 11.6 /100 | #216 | Poor 92.1% |
| Immigrants | Sierra Leone | 11.1 /100 | #217 | Poor 92.0% |
| Blackfeet | 10.1 /100 | #218 | Poor 92.0% |
| Portuguese | 10.0 /100 | #219 | Tragic 92.0% |
| South American Indians | 7.6 /100 | #220 | Tragic 92.0% |
| Immigrants | Liberia | 7.0 /100 | #221 | Tragic 91.9% |
| Immigrants | Africa | 6.5 /100 | #222 | Tragic 91.9% |
| Immigrants | Bahamas | 6.5 /100 | #223 | Tragic 91.9% |
| Costa Ricans | 6.3 /100 | #224 | Tragic 91.9% |
| Immigrants | Zaire | 5.4 /100 | #225 | Tragic 91.9% |
Demographics Similar to Immigrants from Portugal by 11th Grade
In terms of 11th grade, the demographic groups most similar to Immigrants from Portugal are Vietnamese (89.4%, a difference of 0.18%), Immigrants from Caribbean (89.1%, a difference of 0.20%), Cape Verdean (89.1%, a difference of 0.22%), Immigrants from Ecuador (89.1%, a difference of 0.23%), and Yaqui (89.5%, a difference of 0.24%).
| Demographics | Rating | Rank | 11th Grade |
| Immigrants | Cambodia | 0.0 /100 | #305 | Tragic 89.6% |
| Ecuadorians | 0.0 /100 | #306 | Tragic 89.6% |
| Immigrants | Dominica | 0.0 /100 | #307 | Tragic 89.5% |
| Nepalese | 0.0 /100 | #308 | Tragic 89.5% |
| Immigrants | Bangladesh | 0.0 /100 | #309 | Tragic 89.5% |
| Yaqui | 0.0 /100 | #310 | Tragic 89.5% |
| Vietnamese | 0.0 /100 | #311 | Tragic 89.4% |
| Immigrants | Portugal | 0.0 /100 | #312 | Tragic 89.3% |
| Immigrants | Caribbean | 0.0 /100 | #313 | Tragic 89.1% |
| Cape Verdeans | 0.0 /100 | #314 | Tragic 89.1% |
| Immigrants | Ecuador | 0.0 /100 | #315 | Tragic 89.1% |
| Immigrants | Cuba | 0.0 /100 | #316 | Tragic 88.9% |
| Lumbee | 0.0 /100 | #317 | Tragic 88.9% |
| Nicaraguans | 0.0 /100 | #318 | Tragic 88.9% |
| Belizeans | 0.0 /100 | #319 | Tragic 88.8% |