Bhutanese vs Immigrants from Guatemala 5th Grade
COMPARE
Bhutanese
Immigrants from Guatemala
5th Grade
5th Grade Comparison
Bhutanese
Immigrants from Guatemala
97.7%
5TH GRADE
97.6/ 100
METRIC RATING
105th/ 347
METRIC RANK
94.6%
5TH GRADE
0.0/ 100
METRIC RATING
345th/ 347
METRIC RANK
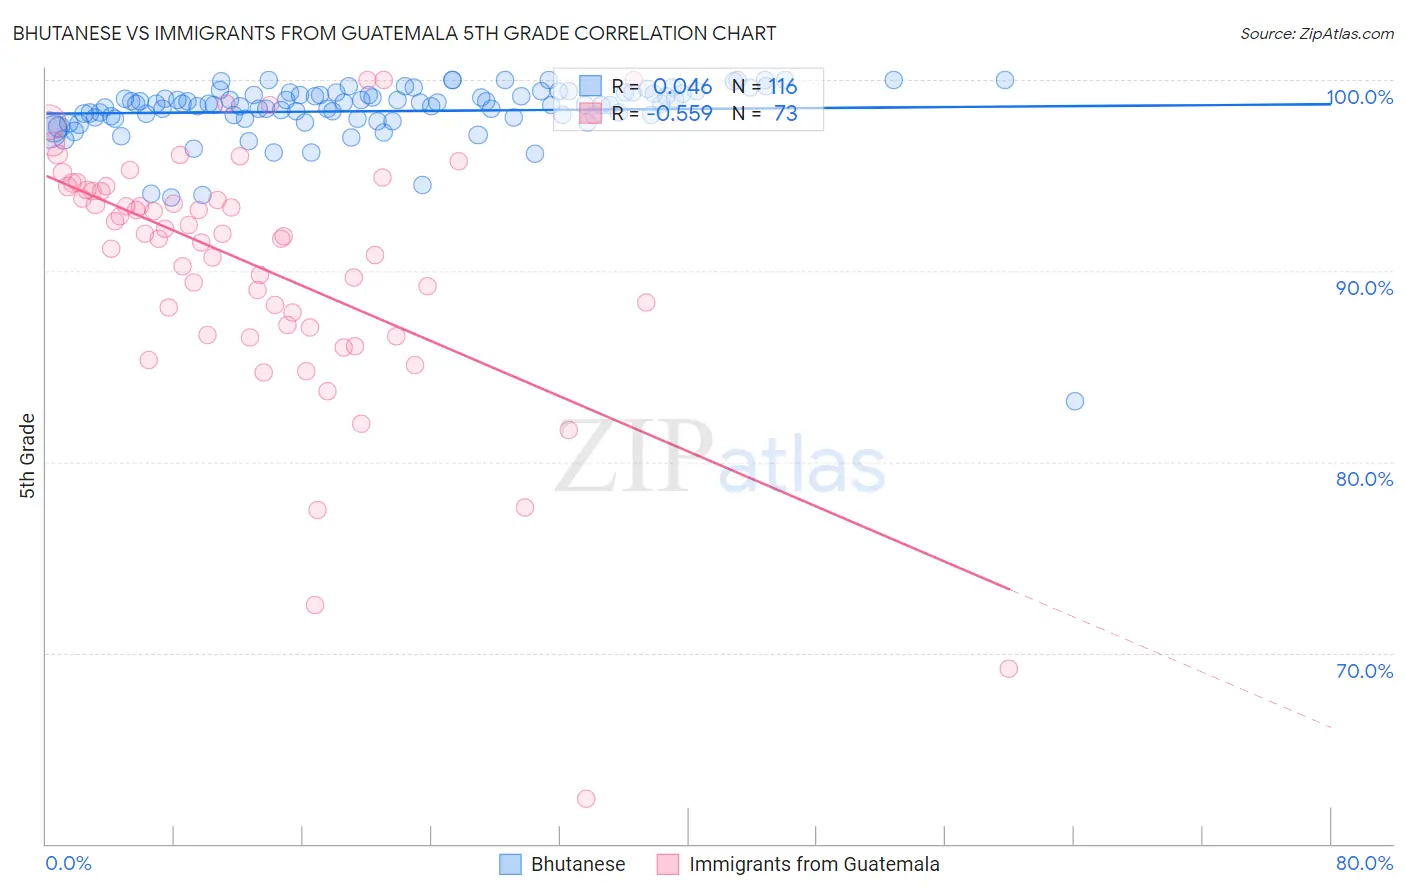
Bhutanese vs Immigrants from Guatemala 5th Grade Correlation Chart
The statistical analysis conducted on geographies consisting of 455,591,134 people shows no correlation between the proportion of Bhutanese and percentage of population with at least 5th grade education in the United States with a correlation coefficient (R) of 0.046 and weighted average of 97.7%. Similarly, the statistical analysis conducted on geographies consisting of 377,285,993 people shows a substantial negative correlation between the proportion of Immigrants from Guatemala and percentage of population with at least 5th grade education in the United States with a correlation coefficient (R) of -0.559 and weighted average of 94.6%, a difference of 3.3%.
5th Grade Correlation Summary
| Measurement | Bhutanese | Immigrants from Guatemala |
| Minimum | 83.2% | 62.4% |
| Maximum | 100.0% | 100.0% |
| Range | 16.8% | 37.6% |
| Mean | 98.4% | 90.3% |
| Median | 98.7% | 92.0% |
| Interquartile 25% (IQ1) | 98.0% | 87.1% |
| Interquartile 75% (IQ3) | 99.3% | 94.3% |
| Interquartile Range (IQR) | 1.3% | 7.2% |
| Standard Deviation (Sample) | 1.9% | 6.7% |
| Standard Deviation (Population) | 1.9% | 6.7% |
Similar Demographics by 5th Grade
Demographics Similar to Bhutanese by 5th Grade
In terms of 5th grade, the demographic groups most similar to Bhutanese are Immigrants from Czechoslovakia (97.7%, a difference of 0.0%), Immigrants from Singapore (97.7%, a difference of 0.0%), German Russian (97.7%, a difference of 0.010%), Nonimmigrants (97.7%, a difference of 0.010%), and Choctaw (97.7%, a difference of 0.020%).
| Demographics | Rating | Rank | 5th Grade |
| Yugoslavians | 98.3 /100 | #98 | Exceptional 97.7% |
| Turks | 98.3 /100 | #99 | Exceptional 97.7% |
| Puget Sound Salish | 98.3 /100 | #100 | Exceptional 97.7% |
| South Africans | 98.3 /100 | #101 | Exceptional 97.7% |
| Choctaw | 98.0 /100 | #102 | Exceptional 97.7% |
| Cheyenne | 97.9 /100 | #103 | Exceptional 97.7% |
| German Russians | 97.8 /100 | #104 | Exceptional 97.7% |
| Bhutanese | 97.6 /100 | #105 | Exceptional 97.7% |
| Immigrants | Czechoslovakia | 97.5 /100 | #106 | Exceptional 97.7% |
| Immigrants | Singapore | 97.5 /100 | #107 | Exceptional 97.7% |
| Immigrants | Nonimmigrants | 97.3 /100 | #108 | Exceptional 97.7% |
| Immigrants | Latvia | 97.1 /100 | #109 | Exceptional 97.7% |
| Thais | 96.9 /100 | #110 | Exceptional 97.7% |
| Menominee | 96.3 /100 | #111 | Exceptional 97.7% |
| Immigrants | Switzerland | 96.0 /100 | #112 | Exceptional 97.7% |
Demographics Similar to Immigrants from Guatemala by 5th Grade
In terms of 5th grade, the demographic groups most similar to Immigrants from Guatemala are Salvadoran (94.6%, a difference of 0.010%), Immigrants from Mexico (94.6%, a difference of 0.010%), Immigrants from Central America (94.7%, a difference of 0.060%), Yakama (94.8%, a difference of 0.16%), and Guatemalan (94.8%, a difference of 0.24%).
| Demographics | Rating | Rank | 5th Grade |
| Immigrants | Latin America | 0.0 /100 | #333 | Tragic 95.3% |
| Nepalese | 0.0 /100 | #334 | Tragic 95.2% |
| Mexicans | 0.0 /100 | #335 | Tragic 95.2% |
| Immigrants | Azores | 0.0 /100 | #336 | Tragic 95.1% |
| Central Americans | 0.0 /100 | #337 | Tragic 95.1% |
| Immigrants | Cabo Verde | 0.0 /100 | #338 | Tragic 94.9% |
| Immigrants | Yemen | 0.0 /100 | #339 | Tragic 94.9% |
| Guatemalans | 0.0 /100 | #340 | Tragic 94.8% |
| Yakama | 0.0 /100 | #341 | Tragic 94.8% |
| Immigrants | Central America | 0.0 /100 | #342 | Tragic 94.7% |
| Salvadorans | 0.0 /100 | #343 | Tragic 94.6% |
| Immigrants | Mexico | 0.0 /100 | #344 | Tragic 94.6% |
| Immigrants | Guatemala | 0.0 /100 | #345 | Tragic 94.6% |
| Immigrants | El Salvador | 0.0 /100 | #346 | Tragic 94.3% |
| Spanish American Indians | 0.0 /100 | #347 | Tragic 94.2% |