Bhutanese vs Austrian 5th Grade
COMPARE
Bhutanese
Austrian
5th Grade
5th Grade Comparison
Bhutanese
Austrians
97.7%
5TH GRADE
97.6/ 100
METRIC RATING
105th/ 347
METRIC RANK
97.9%
5TH GRADE
99.8/ 100
METRIC RATING
57th/ 347
METRIC RANK
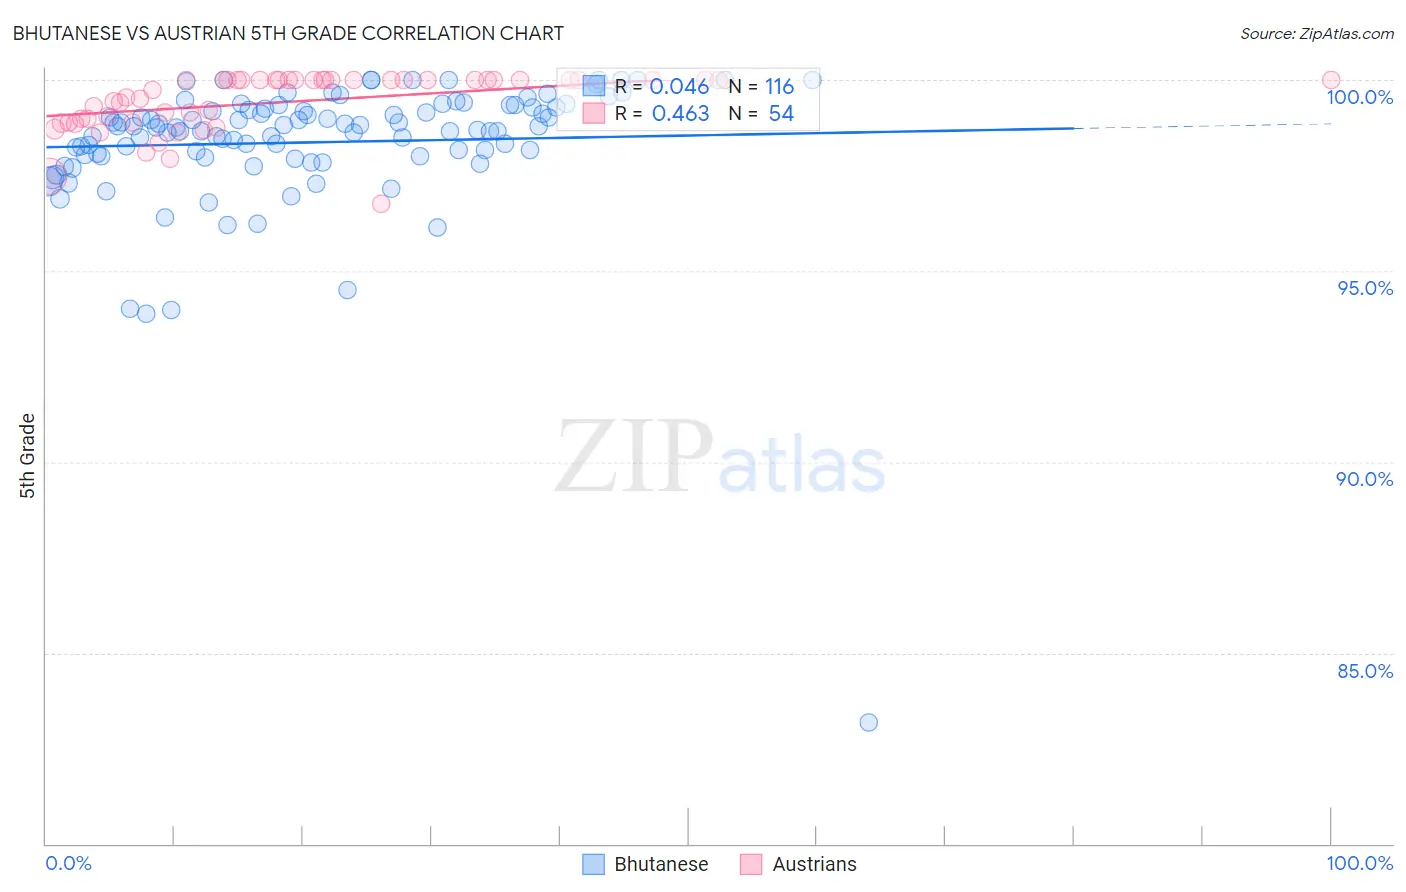
Bhutanese vs Austrian 5th Grade Correlation Chart
The statistical analysis conducted on geographies consisting of 455,591,134 people shows no correlation between the proportion of Bhutanese and percentage of population with at least 5th grade education in the United States with a correlation coefficient (R) of 0.046 and weighted average of 97.7%. Similarly, the statistical analysis conducted on geographies consisting of 452,080,536 people shows a moderate positive correlation between the proportion of Austrians and percentage of population with at least 5th grade education in the United States with a correlation coefficient (R) of 0.463 and weighted average of 97.9%, a difference of 0.25%.
5th Grade Correlation Summary
| Measurement | Bhutanese | Austrian |
| Minimum | 83.2% | 96.8% |
| Maximum | 100.0% | 100.0% |
| Range | 16.8% | 3.2% |
| Mean | 98.4% | 99.4% |
| Median | 98.7% | 100.0% |
| Interquartile 25% (IQ1) | 98.0% | 98.9% |
| Interquartile 75% (IQ3) | 99.3% | 100.0% |
| Interquartile Range (IQR) | 1.3% | 1.1% |
| Standard Deviation (Sample) | 1.9% | 0.75% |
| Standard Deviation (Population) | 1.9% | 0.75% |
Similar Demographics by 5th Grade
Demographics Similar to Bhutanese by 5th Grade
In terms of 5th grade, the demographic groups most similar to Bhutanese are Immigrants from Czechoslovakia (97.7%, a difference of 0.0%), Immigrants from Singapore (97.7%, a difference of 0.0%), German Russian (97.7%, a difference of 0.010%), Nonimmigrants (97.7%, a difference of 0.010%), and Choctaw (97.7%, a difference of 0.020%).
| Demographics | Rating | Rank | 5th Grade |
| Yugoslavians | 98.3 /100 | #98 | Exceptional 97.7% |
| Turks | 98.3 /100 | #99 | Exceptional 97.7% |
| Puget Sound Salish | 98.3 /100 | #100 | Exceptional 97.7% |
| South Africans | 98.3 /100 | #101 | Exceptional 97.7% |
| Choctaw | 98.0 /100 | #102 | Exceptional 97.7% |
| Cheyenne | 97.9 /100 | #103 | Exceptional 97.7% |
| German Russians | 97.8 /100 | #104 | Exceptional 97.7% |
| Bhutanese | 97.6 /100 | #105 | Exceptional 97.7% |
| Immigrants | Czechoslovakia | 97.5 /100 | #106 | Exceptional 97.7% |
| Immigrants | Singapore | 97.5 /100 | #107 | Exceptional 97.7% |
| Immigrants | Nonimmigrants | 97.3 /100 | #108 | Exceptional 97.7% |
| Immigrants | Latvia | 97.1 /100 | #109 | Exceptional 97.7% |
| Thais | 96.9 /100 | #110 | Exceptional 97.7% |
| Menominee | 96.3 /100 | #111 | Exceptional 97.7% |
| Immigrants | Switzerland | 96.0 /100 | #112 | Exceptional 97.7% |
Demographics Similar to Austrians by 5th Grade
In terms of 5th grade, the demographic groups most similar to Austrians are Creek (98.0%, a difference of 0.0%), Greek (97.9%, a difference of 0.0%), White/Caucasian (97.9%, a difference of 0.0%), Australian (98.0%, a difference of 0.010%), and American (97.9%, a difference of 0.010%).
| Demographics | Rating | Rank | 5th Grade |
| Immigrants | Scotland | 99.8 /100 | #50 | Exceptional 98.0% |
| Celtics | 99.8 /100 | #51 | Exceptional 98.0% |
| Maltese | 99.8 /100 | #52 | Exceptional 98.0% |
| Slavs | 99.8 /100 | #53 | Exceptional 98.0% |
| Australians | 99.8 /100 | #54 | Exceptional 98.0% |
| Creek | 99.8 /100 | #55 | Exceptional 98.0% |
| Greeks | 99.8 /100 | #56 | Exceptional 97.9% |
| Austrians | 99.8 /100 | #57 | Exceptional 97.9% |
| Whites/Caucasians | 99.8 /100 | #58 | Exceptional 97.9% |
| Americans | 99.7 /100 | #59 | Exceptional 97.9% |
| Immigrants | Canada | 99.7 /100 | #60 | Exceptional 97.9% |
| Serbians | 99.7 /100 | #61 | Exceptional 97.9% |
| Immigrants | North America | 99.7 /100 | #62 | Exceptional 97.9% |
| Russians | 99.7 /100 | #63 | Exceptional 97.9% |
| Immigrants | Northern Europe | 99.6 /100 | #64 | Exceptional 97.9% |