Immigrants from Sudan vs Immigrants from Bulgaria 5th Grade

COMPARE

Immigrants from Sudan
Race
Ancestry
AfghanAfricanAlaska NativeAlaskan AthabascanAlbanianAleutAlsatianAmericanApacheArabArapahoArgentineanArmenianAssyrian/Chaldean/SyriacAustralianAustrianBahamianBangladeshiBarbadianBasqueBelgianBelizeanBermudanBhutaneseBlackfeetBolivianBrazilianBritishBritish West IndianBulgarianBurmeseCajunCambodianCanadianCape VerdeanCarpatho RusynCelticCentral AmericanCentral American IndianCherokeeCheyenneChickasawChileanChineseChippewaChoctawColombianColvilleComancheCosta RicanCreeCreekCroatianCrowCubanCypriotCzechCzechoslovakianDanishDelawareDominicanDutchDutch West IndianEastern EuropeanEcuadorianEgyptianEnglishEstonianEthiopianEuropeanFijianFilipinoFinnishFrenchFrench American IndianFrench CanadianGermanGerman RussianGhanaianGreekGuamanian/ChamorroGuatemalanGuyaneseHaitianHmongHonduranHopiHoumaHungarianIcelanderIndian (Asian)IndonesianInupiatIranianIraqiIrishIroquoisIsraeliItalianJamaicanJapaneseJordanianKenyanKiowaKoreanLaotianLatvianLebaneseLiberianLithuanianLumbeeLuxembourgerMacedonianMalaysianMalteseMarshalleseMenomineeMexicanMexican American IndianMongolianMoroccanNative HawaiianNavajoNepaleseNew ZealanderNicaraguanNigerianNorthern EuropeanNorwegianOkinawanOsageOttawaPaiutePakistaniPalestinianPanamanianParaguayanPennsylvania GermanPeruvianPimaPolishPortuguesePotawatomiPuebloPuerto RicanPuget Sound SalishRomanianRussianSalvadoranSamoanScandinavianScotch-IrishScottishSeminoleSenegaleseSerbianShoshoneSierra LeoneanSiouxSlavicSlovakSloveneSomaliSouth AfricanSouth AmericanSouth American IndianSoviet UnionSpaniardSpanishSpanish AmericanSpanish American IndianSri LankanSubsaharan AfricanSudaneseSwedishSwissSyrianTaiwaneseThaiTlingit-HaidaTohono O'OdhamTonganTrinidadian and TobagonianTsimshianTurkishU.S. Virgin IslanderUgandanUkrainianUruguayanUteVenezuelanVietnameseWelshWest IndianYakamaYaquiYugoslavianYumanYup'ikZimbabwean
Immigration
NonimmigrantsImmigrantsAfghanistanAfricaAlbaniaArgentinaArmeniaAsiaAustraliaAustriaBahamasBangladeshBarbadosBelarusBelgiumBelizeBoliviaBosnia and HerzegovinaBrazilBurma/MyanmarCabo VerdeCambodiaCameroonCanadaCaribbeanCentral AmericaChileChinaColombiaCongoCosta RicaCroatiaCubaCzechoslovakiaDenmarkDominicaDominican RepublicEastern AfricaEastern AsiaEastern EuropeEcuadorEgyptEl SalvadorEnglandEritreaEthiopiaEuropeFijiFranceGermanyGhanaGreeceGrenadaGuatemalaGuyanaHaitiHondurasHong KongHungaryIndiaIndonesiaIranIraqIrelandIsraelItalyJamaicaJapanJordanKazakhstanKenyaKoreaKuwaitLaosLatin AmericaLatviaLebanonLiberiaLithuaniaMalaysiaMexicoMicronesiaMiddle AfricaMoldovaMoroccoNepalNetherlandsNicaraguaNigeriaNorth AmericaNorth MacedoniaNorthern AfricaNorthern EuropeNorwayOceaniaPakistanPanamaPeruPhilippinesPolandPortugalRomaniaRussiaSaudi ArabiaScotlandSenegalSerbiaSierra LeoneSingaporeSomaliaSouth AfricaSouth AmericaSouth Central AsiaSouth Eastern AsiaSouthern EuropeSpainSri LankaSt. Vincent and the GrenadinesSudanSwedenSwitzerlandSyriaTaiwanThailandTrinidad and TobagoTurkeyUgandaUkraineUruguayUzbekistanVenezuelaVietnamWest IndiesWestern AfricaWestern AsiaWestern EuropeYemenZaireZimbabweAzores
Immigrants from Bulgaria
Race
Ancestry
AfghanAfricanAlaska NativeAlaskan AthabascanAlbanianAleutAlsatianAmericanApacheArabArapahoArgentineanArmenianAssyrian/Chaldean/SyriacAustralianAustrianBahamianBangladeshiBarbadianBasqueBelgianBelizeanBermudanBhutaneseBlackfeetBolivianBrazilianBritishBritish West IndianBulgarianBurmeseCajunCambodianCanadianCape VerdeanCarpatho RusynCelticCentral AmericanCentral American IndianCherokeeCheyenneChickasawChileanChineseChippewaChoctawColombianColvilleComancheCosta RicanCreeCreekCroatianCrowCubanCypriotCzechCzechoslovakianDanishDelawareDominicanDutchDutch West IndianEastern EuropeanEcuadorianEgyptianEnglishEstonianEthiopianEuropeanFijianFilipinoFinnishFrenchFrench American IndianFrench CanadianGermanGerman RussianGhanaianGreekGuamanian/ChamorroGuatemalanGuyaneseHaitianHmongHonduranHopiHoumaHungarianIcelanderIndian (Asian)IndonesianInupiatIranianIraqiIrishIroquoisIsraeliItalianJamaicanJapaneseJordanianKenyanKiowaKoreanLaotianLatvianLebaneseLiberianLithuanianLumbeeLuxembourgerMacedonianMalaysianMalteseMarshalleseMenomineeMexicanMexican American IndianMongolianMoroccanNative HawaiianNavajoNepaleseNew ZealanderNicaraguanNigerianNorthern EuropeanNorwegianOkinawanOsageOttawaPaiutePakistaniPalestinianPanamanianParaguayanPennsylvania GermanPeruvianPimaPolishPortuguesePotawatomiPuebloPuerto RicanPuget Sound SalishRomanianRussianSalvadoranSamoanScandinavianScotch-IrishScottishSeminoleSenegaleseSerbianShoshoneSierra LeoneanSiouxSlavicSlovakSloveneSomaliSouth AfricanSouth AmericanSouth American IndianSoviet UnionSpaniardSpanishSpanish AmericanSpanish American IndianSri LankanSubsaharan AfricanSudaneseSwedishSwissSyrianTaiwaneseThaiTlingit-HaidaTohono O'OdhamTonganTrinidadian and TobagonianTsimshianTurkishU.S. Virgin IslanderUgandanUkrainianUruguayanUteVenezuelanVietnameseWelshWest IndianYakamaYaquiYugoslavianYumanYup'ikZimbabwean
Immigration
NonimmigrantsImmigrantsAfghanistanAfricaAlbaniaArgentinaArmeniaAsiaAustraliaAustriaBahamasBangladeshBarbadosBelarusBelgiumBelizeBoliviaBosnia and HerzegovinaBrazilBulgariaBurma/MyanmarCabo VerdeCambodiaCameroonCanadaCaribbeanCentral AmericaChileChinaColombiaCongoCosta RicaCroatiaCubaCzechoslovakiaDenmarkDominicaDominican RepublicEastern AfricaEastern AsiaEastern EuropeEcuadorEgyptEl SalvadorEnglandEritreaEthiopiaEuropeFijiFranceGermanyGhanaGreeceGrenadaGuatemalaGuyanaHaitiHondurasHong KongHungaryIndiaIndonesiaIranIraqIrelandIsraelItalyJamaicaJapanJordanKazakhstanKenyaKoreaKuwaitLaosLatin AmericaLatviaLebanonLiberiaLithuaniaMalaysiaMexicoMicronesiaMiddle AfricaMoldovaMoroccoNepalNetherlandsNicaraguaNigeriaNorth AmericaNorth MacedoniaNorthern AfricaNorthern EuropeNorwayOceaniaPakistanPanamaPeruPhilippinesPolandPortugalRomaniaRussiaSaudi ArabiaScotlandSenegalSerbiaSierra LeoneSingaporeSomaliaSouth AfricaSouth AmericaSouth Central AsiaSouth Eastern AsiaSouthern EuropeSpainSri LankaSt. Vincent and the GrenadinesSwedenSwitzerlandSyriaTaiwanThailandTrinidad and TobagoTurkeyUgandaUkraineUruguayUzbekistanVenezuelaVietnamWest IndiesWestern AfricaWestern AsiaWestern EuropeYemenZaireZimbabweAzores
5th Grade
Income
Poverty
Unemployment
Labor Participation
Family Structure
Vehicle Availability
Education Level
Disability

5th Grade Comparison

Immigrants from Sudan

Immigrants from Bulgaria

Tragic
Exceptional
97.1%
5TH GRADE
6.5/ 100
METRIC RATING
218th/ 347
METRIC RANK
97.6%
5TH GRADE
93.1/ 100
METRIC RATING
125th/ 347
METRIC RANK

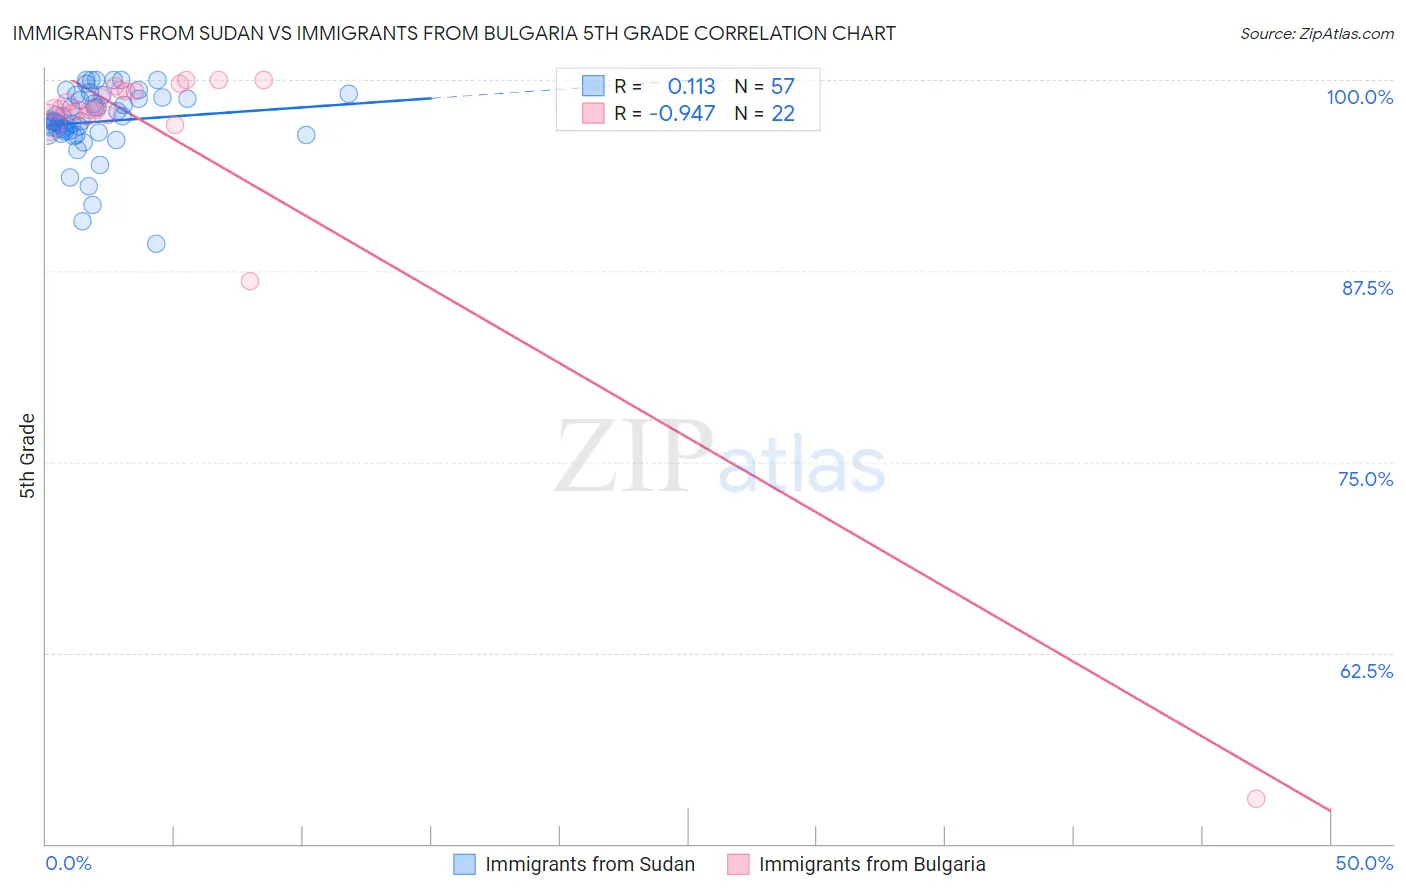
Immigrants from Sudan vs Immigrants from Bulgaria 5th Grade Correlation Chart

The statistical analysis conducted on geographies consisting of 118,959,807 people shows a poor positive correlation between the proportion of Immigrants from Sudan and percentage of population with at least 5th grade education in the United States with a correlation coefficient (R) of 0.113 and weighted average of 97.1%. Similarly, the statistical analysis conducted on geographies consisting of 172,552,181 people shows a near-perfect negative correlation between the proportion of Immigrants from Bulgaria and percentage of population with at least 5th grade education in the United States with a correlation coefficient (R) of -0.947 and weighted average of 97.6%, a difference of 0.55%.
Immigrants from Sudan vs Immigrants from Bulgaria 5th Grade

5th Grade Correlation Summary

MeasurementImmigrants from SudanImmigrants from Bulgaria
Minimum89.3%52.9%
Maximum100.0%100.0%
Range10.7%47.1%
Mean97.3%96.0%
Median97.3%98.1%
Interquartile 25% (IQ1)96.6%97.7%
Interquartile 75% (IQ3)98.8%99.4%
Interquartile Range (IQR)2.2%1.7%
Standard Deviation (Sample)2.2%10.0%
Standard Deviation (Population)2.2%9.8%

Similar Demographics by 5th Grade

Demographics Similar to Immigrants from Sudan by 5th Grade

In terms of 5th grade, the demographic groups most similar to Immigrants from Sudan are Immigrants from Lebanon (97.1%, a difference of 0.0%), Immigrants from Syria (97.1%, a difference of 0.0%), Immigrants from Southern Europe (97.1%, a difference of 0.0%), Immigrants from Morocco (97.1%, a difference of 0.010%), and Sudanese (97.1%, a difference of 0.010%).
DemographicsRating | Rank5th Grade
Samoans
8.5
/100
|
#211
Tragic
97.1%
Immigrants | Iraq
8.3
/100
|
#212
Tragic
97.1%
Portuguese
7.8
/100
|
#213
Tragic
97.1%
Costa Ricans
7.7
/100
|
#214
Tragic
97.1%
Immigrants | Morocco
7.5
/100
|
#215
Tragic
97.1%
Sudanese
7.0
/100
|
#216
Tragic
97.1%
Immigrants | Lebanon
6.8
/100
|
#217
Tragic
97.1%
Immigrants | Sudan
6.5
/100
|
#218
Tragic
97.1%
Immigrants | Syria
6.4
/100
|
#219
Tragic
97.1%
Immigrants | Southern Europe
6.3
/100
|
#220
Tragic
97.1%
Sierra Leoneans
6.0
/100
|
#221
Tragic
97.1%
Immigrants | Panama
5.7
/100
|
#222
Tragic
97.0%
Liberians
5.7
/100
|
#223
Tragic
97.0%
South American Indians
5.4
/100
|
#224
Tragic
97.0%
Bahamians
5.3
/100
|
#225
Tragic
97.0%

Demographics Similar to Immigrants from Bulgaria by 5th Grade

In terms of 5th grade, the demographic groups most similar to Immigrants from Bulgaria are Spanish (97.6%, a difference of 0.010%), Hmong (97.6%, a difference of 0.010%), Immigrants from Serbia (97.6%, a difference of 0.010%), Colville (97.6%, a difference of 0.020%), and Immigrants from Europe (97.6%, a difference of 0.020%).
DemographicsRating | Rank5th Grade
Basques
95.2
/100
|
#118
Exceptional
97.6%
Syrians
95.1
/100
|
#119
Exceptional
97.6%
Immigrants | Zimbabwe
94.9
/100
|
#120
Exceptional
97.6%
Immigrants | France
94.8
/100
|
#121
Exceptional
97.6%
Immigrants | Japan
94.7
/100
|
#122
Exceptional
97.6%
Immigrants | Norway
94.6
/100
|
#123
Exceptional
97.6%
Spanish
93.7
/100
|
#124
Exceptional
97.6%
Immigrants | Bulgaria
93.1
/100
|
#125
Exceptional
97.6%
Hmong
92.3
/100
|
#126
Exceptional
97.6%
Immigrants | Serbia
92.3
/100
|
#127
Exceptional
97.6%
Colville
92.0
/100
|
#128
Exceptional
97.6%
Immigrants | Europe
91.9
/100
|
#129
Exceptional
97.6%
Immigrants | Romania
91.6
/100
|
#130
Exceptional
97.6%
Pima
91.2
/100
|
#131
Exceptional
97.6%
Immigrants | Kuwait
90.4
/100
|
#132
Exceptional
97.6%