Bahamian vs Immigrants from Bulgaria 5th Grade
COMPARE
Bahamian
Immigrants from Bulgaria
5th Grade
5th Grade Comparison
Bahamians
Immigrants from Bulgaria
97.0%
5TH GRADE
5.3/ 100
METRIC RATING
225th/ 347
METRIC RANK
97.6%
5TH GRADE
93.1/ 100
METRIC RATING
125th/ 347
METRIC RANK
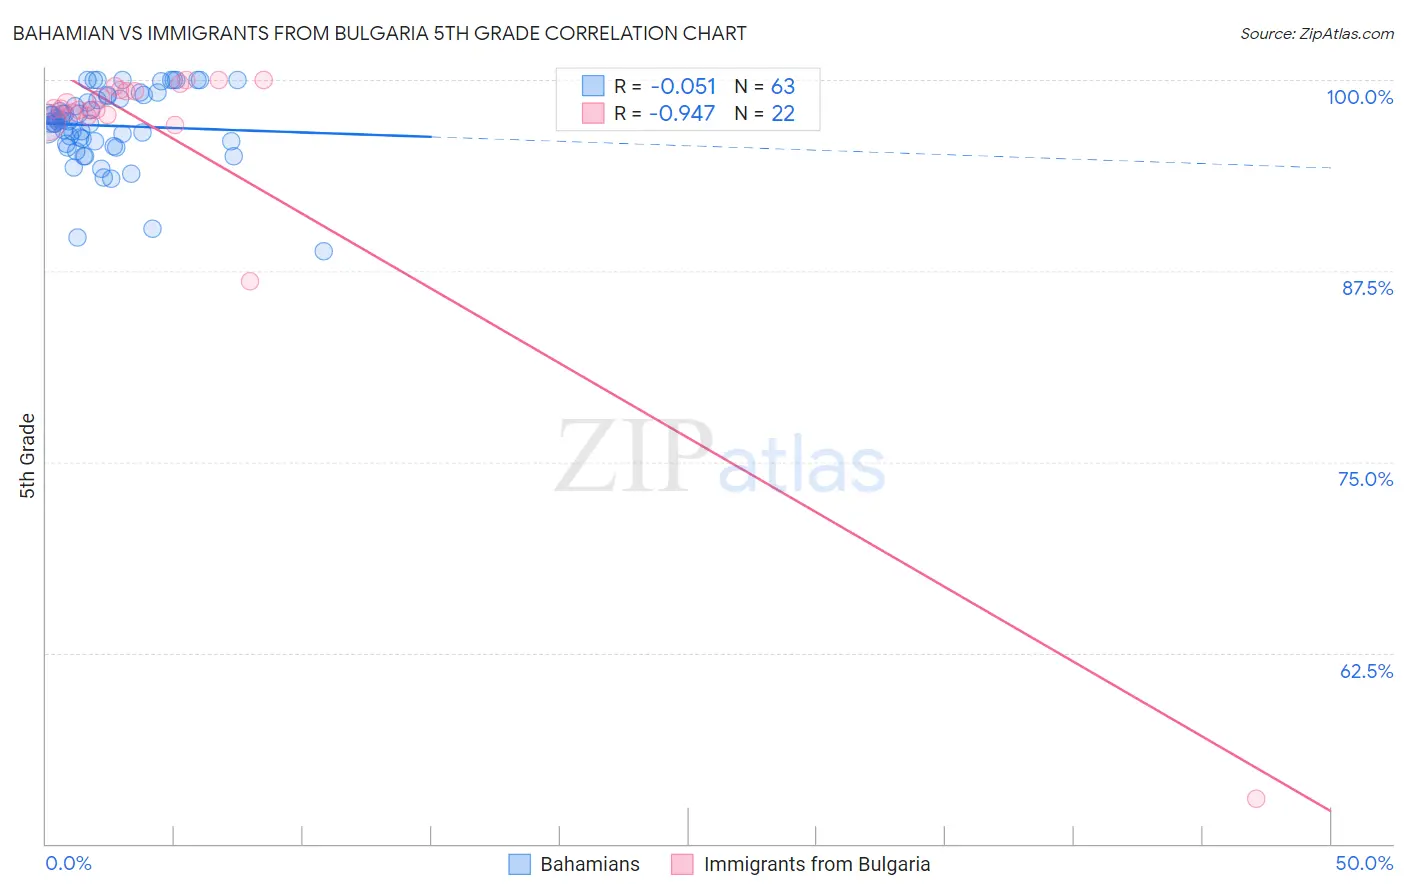
Bahamian vs Immigrants from Bulgaria 5th Grade Correlation Chart
The statistical analysis conducted on geographies consisting of 112,698,819 people shows a slight negative correlation between the proportion of Bahamians and percentage of population with at least 5th grade education in the United States with a correlation coefficient (R) of -0.051 and weighted average of 97.0%. Similarly, the statistical analysis conducted on geographies consisting of 172,552,181 people shows a near-perfect negative correlation between the proportion of Immigrants from Bulgaria and percentage of population with at least 5th grade education in the United States with a correlation coefficient (R) of -0.947 and weighted average of 97.6%, a difference of 0.57%.
5th Grade Correlation Summary
| Measurement | Bahamian | Immigrants from Bulgaria |
| Minimum | 88.8% | 52.9% |
| Maximum | 100.0% | 100.0% |
| Range | 11.2% | 47.1% |
| Mean | 97.0% | 96.0% |
| Median | 97.3% | 98.1% |
| Interquartile 25% (IQ1) | 95.8% | 97.7% |
| Interquartile 75% (IQ3) | 98.9% | 99.4% |
| Interquartile Range (IQR) | 3.1% | 1.7% |
| Standard Deviation (Sample) | 2.5% | 10.0% |
| Standard Deviation (Population) | 2.4% | 9.8% |
Similar Demographics by 5th Grade
Demographics Similar to Bahamians by 5th Grade
In terms of 5th grade, the demographic groups most similar to Bahamians are South American Indian (97.0%, a difference of 0.0%), Tongan (97.0%, a difference of 0.0%), Sierra Leonean (97.1%, a difference of 0.010%), Immigrants from Panama (97.0%, a difference of 0.010%), and Liberian (97.0%, a difference of 0.010%).
| Demographics | Rating | Rank | 5th Grade |
| Immigrants | Sudan | 6.5 /100 | #218 | Tragic 97.1% |
| Immigrants | Syria | 6.4 /100 | #219 | Tragic 97.1% |
| Immigrants | Southern Europe | 6.3 /100 | #220 | Tragic 97.1% |
| Sierra Leoneans | 6.0 /100 | #221 | Tragic 97.1% |
| Immigrants | Panama | 5.7 /100 | #222 | Tragic 97.0% |
| Liberians | 5.7 /100 | #223 | Tragic 97.0% |
| South American Indians | 5.4 /100 | #224 | Tragic 97.0% |
| Bahamians | 5.3 /100 | #225 | Tragic 97.0% |
| Tongans | 5.3 /100 | #226 | Tragic 97.0% |
| Immigrants | Pakistan | 4.7 /100 | #227 | Tragic 97.0% |
| Assyrians/Chaldeans/Syriacs | 4.5 /100 | #228 | Tragic 97.0% |
| Yuman | 4.5 /100 | #229 | Tragic 97.0% |
| Immigrants | Western Asia | 4.3 /100 | #230 | Tragic 97.0% |
| Immigrants | Malaysia | 4.1 /100 | #231 | Tragic 97.0% |
| Immigrants | Eastern Asia | 4.0 /100 | #232 | Tragic 97.0% |
Demographics Similar to Immigrants from Bulgaria by 5th Grade
In terms of 5th grade, the demographic groups most similar to Immigrants from Bulgaria are Spanish (97.6%, a difference of 0.010%), Hmong (97.6%, a difference of 0.010%), Immigrants from Serbia (97.6%, a difference of 0.010%), Colville (97.6%, a difference of 0.020%), and Immigrants from Europe (97.6%, a difference of 0.020%).
| Demographics | Rating | Rank | 5th Grade |
| Basques | 95.2 /100 | #118 | Exceptional 97.6% |
| Syrians | 95.1 /100 | #119 | Exceptional 97.6% |
| Immigrants | Zimbabwe | 94.9 /100 | #120 | Exceptional 97.6% |
| Immigrants | France | 94.8 /100 | #121 | Exceptional 97.6% |
| Immigrants | Japan | 94.7 /100 | #122 | Exceptional 97.6% |
| Immigrants | Norway | 94.6 /100 | #123 | Exceptional 97.6% |
| Spanish | 93.7 /100 | #124 | Exceptional 97.6% |
| Immigrants | Bulgaria | 93.1 /100 | #125 | Exceptional 97.6% |
| Hmong | 92.3 /100 | #126 | Exceptional 97.6% |
| Immigrants | Serbia | 92.3 /100 | #127 | Exceptional 97.6% |
| Colville | 92.0 /100 | #128 | Exceptional 97.6% |
| Immigrants | Europe | 91.9 /100 | #129 | Exceptional 97.6% |
| Immigrants | Romania | 91.6 /100 | #130 | Exceptional 97.6% |
| Pima | 91.2 /100 | #131 | Exceptional 97.6% |
| Immigrants | Kuwait | 90.4 /100 | #132 | Exceptional 97.6% |