Nepalese vs Immigrants from Fiji Master's Degree
COMPARE
Nepalese
Immigrants from Fiji
Master's Degree
Master's Degree Comparison
Nepalese
Immigrants from Fiji
10.5%
MASTER'S DEGREE
0.0/ 100
METRIC RATING
329th/ 347
METRIC RANK
12.4%
MASTER'S DEGREE
0.5/ 100
METRIC RATING
265th/ 347
METRIC RANK
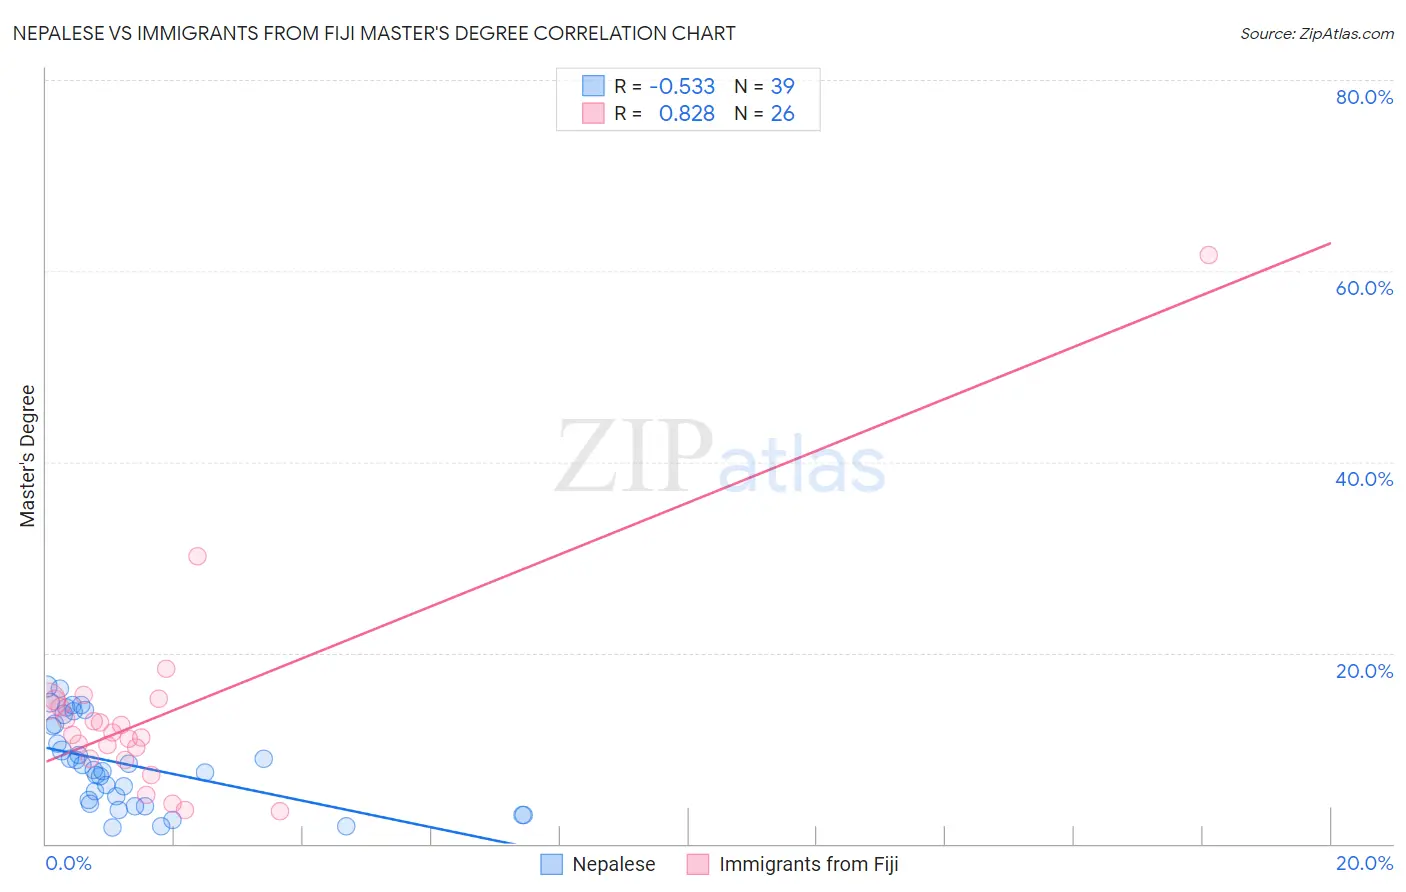
Nepalese vs Immigrants from Fiji Master's Degree Correlation Chart
The statistical analysis conducted on geographies consisting of 24,519,269 people shows a substantial negative correlation between the proportion of Nepalese and percentage of population with at least master's degree education in the United States with a correlation coefficient (R) of -0.533 and weighted average of 10.5%. Similarly, the statistical analysis conducted on geographies consisting of 93,754,667 people shows a very strong positive correlation between the proportion of Immigrants from Fiji and percentage of population with at least master's degree education in the United States with a correlation coefficient (R) of 0.828 and weighted average of 12.4%, a difference of 18.6%.
Master's Degree Correlation Summary
| Measurement | Nepalese | Immigrants from Fiji |
| Minimum | 1.7% | 3.5% |
| Maximum | 16.5% | 61.7% |
| Range | 14.8% | 58.2% |
| Mean | 8.3% | 13.6% |
| Median | 7.8% | 11.5% |
| Interquartile 25% (IQ1) | 4.2% | 8.9% |
| Interquartile 75% (IQ3) | 12.5% | 14.9% |
| Interquartile Range (IQR) | 8.3% | 6.0% |
| Standard Deviation (Sample) | 4.5% | 11.2% |
| Standard Deviation (Population) | 4.4% | 11.0% |
Similar Demographics by Master's Degree
Demographics Similar to Nepalese by Master's Degree
In terms of master's degree, the demographic groups most similar to Nepalese are Bangladeshi (10.5%, a difference of 0.080%), Paiute (10.5%, a difference of 0.21%), Inupiat (10.5%, a difference of 0.40%), Creek (10.5%, a difference of 0.40%), and Dutch West Indian (10.6%, a difference of 1.5%).
| Demographics | Rating | Rank | Master's Degree |
| Sioux | 0.0 /100 | #322 | Tragic 10.7% |
| Crow | 0.0 /100 | #323 | Tragic 10.6% |
| Dutch West Indians | 0.0 /100 | #324 | Tragic 10.6% |
| Inupiat | 0.0 /100 | #325 | Tragic 10.5% |
| Creek | 0.0 /100 | #326 | Tragic 10.5% |
| Paiute | 0.0 /100 | #327 | Tragic 10.5% |
| Bangladeshis | 0.0 /100 | #328 | Tragic 10.5% |
| Nepalese | 0.0 /100 | #329 | Tragic 10.5% |
| Fijians | 0.0 /100 | #330 | Tragic 10.3% |
| Pueblo | 0.0 /100 | #331 | Tragic 10.3% |
| Immigrants | Azores | 0.0 /100 | #332 | Tragic 10.2% |
| Menominee | 0.0 /100 | #333 | Tragic 10.2% |
| Arapaho | 0.0 /100 | #334 | Tragic 10.0% |
| Immigrants | Central America | 0.0 /100 | #335 | Tragic 10.0% |
| Natives/Alaskans | 0.0 /100 | #336 | Tragic 9.9% |
Demographics Similar to Immigrants from Fiji by Master's Degree
In terms of master's degree, the demographic groups most similar to Immigrants from Fiji are Belizean (12.4%, a difference of 0.020%), Bahamian (12.4%, a difference of 0.16%), Central American Indian (12.4%, a difference of 0.19%), Nicaraguan (12.5%, a difference of 0.42%), and Tongan (12.5%, a difference of 0.61%).
| Demographics | Rating | Rank | Master's Degree |
| Immigrants | Liberia | 0.6 /100 | #258 | Tragic 12.5% |
| Japanese | 0.6 /100 | #259 | Tragic 12.5% |
| Dominicans | 0.6 /100 | #260 | Tragic 12.5% |
| Tongans | 0.6 /100 | #261 | Tragic 12.5% |
| Nicaraguans | 0.6 /100 | #262 | Tragic 12.5% |
| Central American Indians | 0.5 /100 | #263 | Tragic 12.4% |
| Belizeans | 0.5 /100 | #264 | Tragic 12.4% |
| Immigrants | Fiji | 0.5 /100 | #265 | Tragic 12.4% |
| Bahamians | 0.5 /100 | #266 | Tragic 12.4% |
| Americans | 0.4 /100 | #267 | Tragic 12.3% |
| Native Hawaiians | 0.4 /100 | #268 | Tragic 12.3% |
| Central Americans | 0.3 /100 | #269 | Tragic 12.2% |
| Salvadorans | 0.3 /100 | #270 | Tragic 12.2% |
| Haitians | 0.3 /100 | #271 | Tragic 12.1% |
| Comanche | 0.3 /100 | #272 | Tragic 12.1% |