Bermudan vs Nicaraguan High School Diploma
COMPARE
Bermudan
Nicaraguan
High School Diploma
High School Diploma Comparison
Bermudans
Nicaraguans
89.3%
HIGH SCHOOL DIPLOMA
61.1/ 100
METRIC RATING
162nd/ 347
METRIC RANK
84.1%
HIGH SCHOOL DIPLOMA
0.0/ 100
METRIC RATING
320th/ 347
METRIC RANK
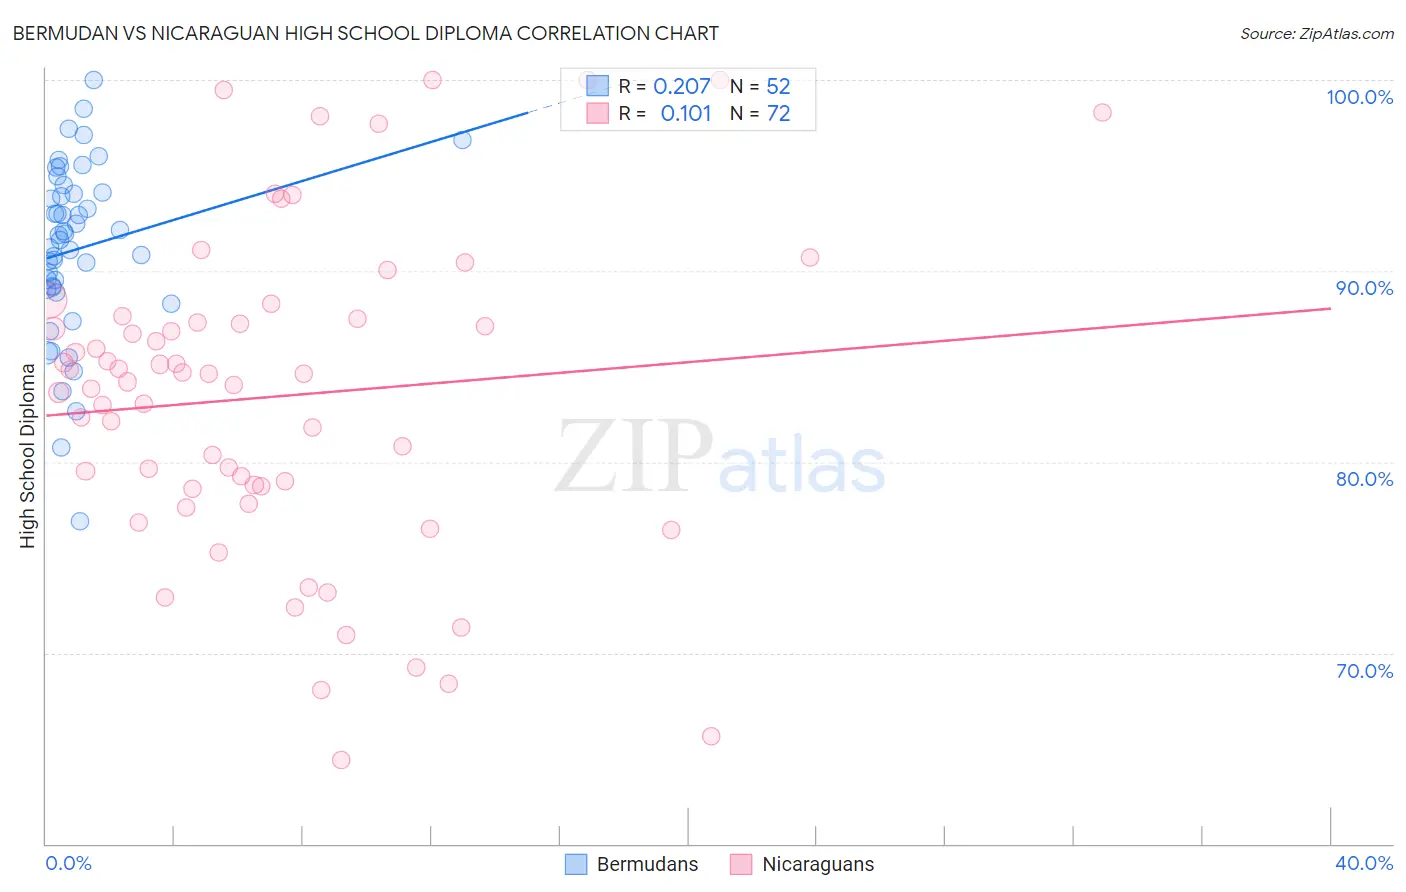
Bermudan vs Nicaraguan High School Diploma Correlation Chart
The statistical analysis conducted on geographies consisting of 55,730,379 people shows a weak positive correlation between the proportion of Bermudans and percentage of population with at least high school diploma education in the United States with a correlation coefficient (R) of 0.207 and weighted average of 89.3%. Similarly, the statistical analysis conducted on geographies consisting of 285,710,633 people shows a poor positive correlation between the proportion of Nicaraguans and percentage of population with at least high school diploma education in the United States with a correlation coefficient (R) of 0.101 and weighted average of 84.1%, a difference of 6.2%.
High School Diploma Correlation Summary
| Measurement | Bermudan | Nicaraguan |
| Minimum | 76.9% | 64.4% |
| Maximum | 100.0% | 100.0% |
| Range | 23.1% | 35.6% |
| Mean | 91.1% | 83.4% |
| Median | 91.7% | 84.4% |
| Interquartile 25% (IQ1) | 89.1% | 78.7% |
| Interquartile 75% (IQ3) | 94.1% | 87.4% |
| Interquartile Range (IQR) | 5.0% | 8.8% |
| Standard Deviation (Sample) | 4.6% | 8.4% |
| Standard Deviation (Population) | 4.5% | 8.3% |
Similar Demographics by High School Diploma
Demographics Similar to Bermudans by High School Diploma
In terms of high school diploma, the demographic groups most similar to Bermudans are Brazilian (89.3%, a difference of 0.0%), Cree (89.3%, a difference of 0.0%), Immigrants from Nepal (89.3%, a difference of 0.0%), Immigrants from China (89.3%, a difference of 0.010%), and Laotian (89.3%, a difference of 0.010%).
| Demographics | Rating | Rank | High School Diploma |
| Immigrants | Northern Africa | 66.4 /100 | #155 | Good 89.4% |
| Immigrants | Argentina | 65.5 /100 | #156 | Good 89.4% |
| Immigrants | Malaysia | 63.5 /100 | #157 | Good 89.3% |
| Immigrants | Pakistan | 62.5 /100 | #158 | Good 89.3% |
| Immigrants | China | 62.0 /100 | #159 | Good 89.3% |
| Laotians | 61.8 /100 | #160 | Good 89.3% |
| Brazilians | 61.2 /100 | #161 | Good 89.3% |
| Bermudans | 61.1 /100 | #162 | Good 89.3% |
| Cree | 61.1 /100 | #163 | Good 89.3% |
| Immigrants | Nepal | 61.1 /100 | #164 | Good 89.3% |
| Immigrants | Asia | 59.8 /100 | #165 | Average 89.3% |
| Immigrants | Albania | 59.4 /100 | #166 | Average 89.3% |
| Immigrants | Hong Kong | 58.6 /100 | #167 | Average 89.3% |
| Delaware | 55.8 /100 | #168 | Average 89.2% |
| Iroquois | 55.1 /100 | #169 | Average 89.2% |
Demographics Similar to Nicaraguans by High School Diploma
In terms of high school diploma, the demographic groups most similar to Nicaraguans are Central American Indian (84.2%, a difference of 0.10%), Immigrants from Belize (84.2%, a difference of 0.14%), Yuman (84.0%, a difference of 0.14%), Immigrants from Caribbean (84.3%, a difference of 0.21%), and Belizean (84.3%, a difference of 0.26%).
| Demographics | Rating | Rank | High School Diploma |
| Immigrants | Ecuador | 0.0 /100 | #313 | Tragic 84.8% |
| Yaqui | 0.0 /100 | #314 | Tragic 84.7% |
| Puerto Ricans | 0.0 /100 | #315 | Tragic 84.7% |
| Belizeans | 0.0 /100 | #316 | Tragic 84.3% |
| Immigrants | Caribbean | 0.0 /100 | #317 | Tragic 84.3% |
| Immigrants | Belize | 0.0 /100 | #318 | Tragic 84.2% |
| Central American Indians | 0.0 /100 | #319 | Tragic 84.2% |
| Nicaraguans | 0.0 /100 | #320 | Tragic 84.1% |
| Yuman | 0.0 /100 | #321 | Tragic 84.0% |
| Lumbee | 0.0 /100 | #322 | Tragic 83.6% |
| Immigrants | Cuba | 0.0 /100 | #323 | Tragic 83.5% |
| Immigrants | Cabo Verde | 0.0 /100 | #324 | Tragic 83.3% |
| Immigrants | Nicaragua | 0.0 /100 | #325 | Tragic 83.1% |
| Mexican American Indians | 0.0 /100 | #326 | Tragic 83.0% |
| Hondurans | 0.0 /100 | #327 | Tragic 83.0% |