Belizean vs South African Bachelor's Degree
COMPARE
Belizean
South African
Bachelor's Degree
Bachelor's Degree Comparison
Belizeans
South Africans
32.8%
BACHELOR'S DEGREE
0.4/ 100
METRIC RATING
263rd/ 347
METRIC RANK
43.6%
BACHELOR'S DEGREE
99.8/ 100
METRIC RATING
61st/ 347
METRIC RANK
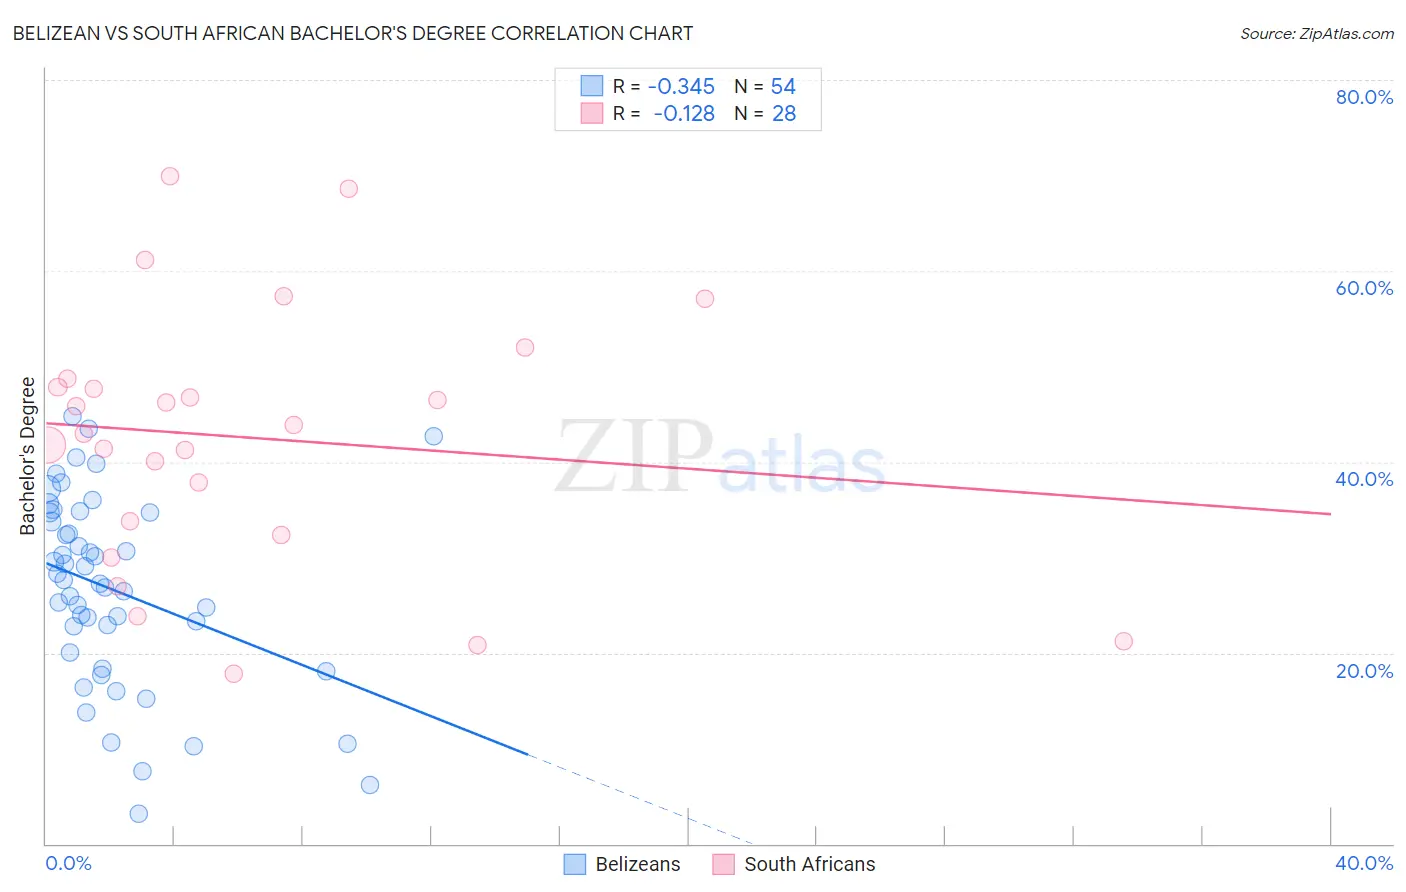
Belizean vs South African Bachelor's Degree Correlation Chart
The statistical analysis conducted on geographies consisting of 144,217,476 people shows a mild negative correlation between the proportion of Belizeans and percentage of population with at least bachelor's degree education in the United States with a correlation coefficient (R) of -0.345 and weighted average of 32.8%. Similarly, the statistical analysis conducted on geographies consisting of 182,590,093 people shows a poor negative correlation between the proportion of South Africans and percentage of population with at least bachelor's degree education in the United States with a correlation coefficient (R) of -0.128 and weighted average of 43.6%, a difference of 32.8%.
Bachelor's Degree Correlation Summary
| Measurement | Belizean | South African |
| Minimum | 3.1% | 17.8% |
| Maximum | 44.8% | 69.9% |
| Range | 41.6% | 52.1% |
| Mean | 26.6% | 42.6% |
| Median | 27.4% | 43.4% |
| Interquartile 25% (IQ1) | 20.1% | 33.1% |
| Interquartile 75% (IQ3) | 34.7% | 48.3% |
| Interquartile Range (IQR) | 14.6% | 15.2% |
| Standard Deviation (Sample) | 10.0% | 13.5% |
| Standard Deviation (Population) | 9.9% | 13.3% |
Similar Demographics by Bachelor's Degree
Demographics Similar to Belizeans by Bachelor's Degree
In terms of bachelor's degree, the demographic groups most similar to Belizeans are African (32.9%, a difference of 0.29%), Immigrants from Jamaica (32.9%, a difference of 0.29%), Malaysian (32.9%, a difference of 0.38%), Osage (33.0%, a difference of 0.75%), and Central American Indian (32.5%, a difference of 0.78%).
| Demographics | Rating | Rank | Bachelor's Degree |
| Nicaraguans | 0.6 /100 | #256 | Tragic 33.1% |
| Spanish Americans | 0.6 /100 | #257 | Tragic 33.1% |
| French American Indians | 0.6 /100 | #258 | Tragic 33.1% |
| Osage | 0.5 /100 | #259 | Tragic 33.0% |
| Malaysians | 0.5 /100 | #260 | Tragic 32.9% |
| Africans | 0.5 /100 | #261 | Tragic 32.9% |
| Immigrants | Jamaica | 0.5 /100 | #262 | Tragic 32.9% |
| Belizeans | 0.4 /100 | #263 | Tragic 32.8% |
| Central American Indians | 0.3 /100 | #264 | Tragic 32.5% |
| Bahamians | 0.3 /100 | #265 | Tragic 32.5% |
| Immigrants | Dominica | 0.3 /100 | #266 | Tragic 32.5% |
| Cubans | 0.3 /100 | #267 | Tragic 32.5% |
| Immigrants | Portugal | 0.2 /100 | #268 | Tragic 32.2% |
| Immigrants | Belize | 0.2 /100 | #269 | Tragic 32.1% |
| Immigrants | Nicaragua | 0.2 /100 | #270 | Tragic 31.9% |
Demographics Similar to South Africans by Bachelor's Degree
In terms of bachelor's degree, the demographic groups most similar to South Africans are Immigrants from Kazakhstan (43.4%, a difference of 0.30%), Immigrants from Europe (43.4%, a difference of 0.34%), Argentinean (43.3%, a difference of 0.62%), Zimbabwean (43.3%, a difference of 0.62%), and Immigrants from Netherlands (43.3%, a difference of 0.64%).
| Demographics | Rating | Rank | Bachelor's Degree |
| Immigrants | Austria | 99.9 /100 | #54 | Exceptional 44.2% |
| Immigrants | Bolivia | 99.9 /100 | #55 | Exceptional 44.2% |
| Immigrants | Serbia | 99.9 /100 | #56 | Exceptional 44.1% |
| Paraguayans | 99.9 /100 | #57 | Exceptional 44.0% |
| Immigrants | Czechoslovakia | 99.9 /100 | #58 | Exceptional 44.0% |
| Australians | 99.9 /100 | #59 | Exceptional 44.0% |
| New Zealanders | 99.9 /100 | #60 | Exceptional 44.0% |
| South Africans | 99.8 /100 | #61 | Exceptional 43.6% |
| Immigrants | Kazakhstan | 99.8 /100 | #62 | Exceptional 43.4% |
| Immigrants | Europe | 99.8 /100 | #63 | Exceptional 43.4% |
| Argentineans | 99.7 /100 | #64 | Exceptional 43.3% |
| Zimbabweans | 99.7 /100 | #65 | Exceptional 43.3% |
| Immigrants | Netherlands | 99.7 /100 | #66 | Exceptional 43.3% |
| Egyptians | 99.7 /100 | #67 | Exceptional 43.3% |
| Immigrants | Indonesia | 99.7 /100 | #68 | Exceptional 43.3% |