Belizean vs Immigrants from Kazakhstan GED/Equivalency
COMPARE
Belizean
Immigrants from Kazakhstan
GED/Equivalency
GED/Equivalency Comparison
Belizeans
Immigrants from Kazakhstan
80.9%
GED/EQUIVALENCY
0.0/ 100
METRIC RATING
314th/ 347
METRIC RANK
87.0%
GED/EQUIVALENCY
94.7/ 100
METRIC RATING
114th/ 347
METRIC RANK
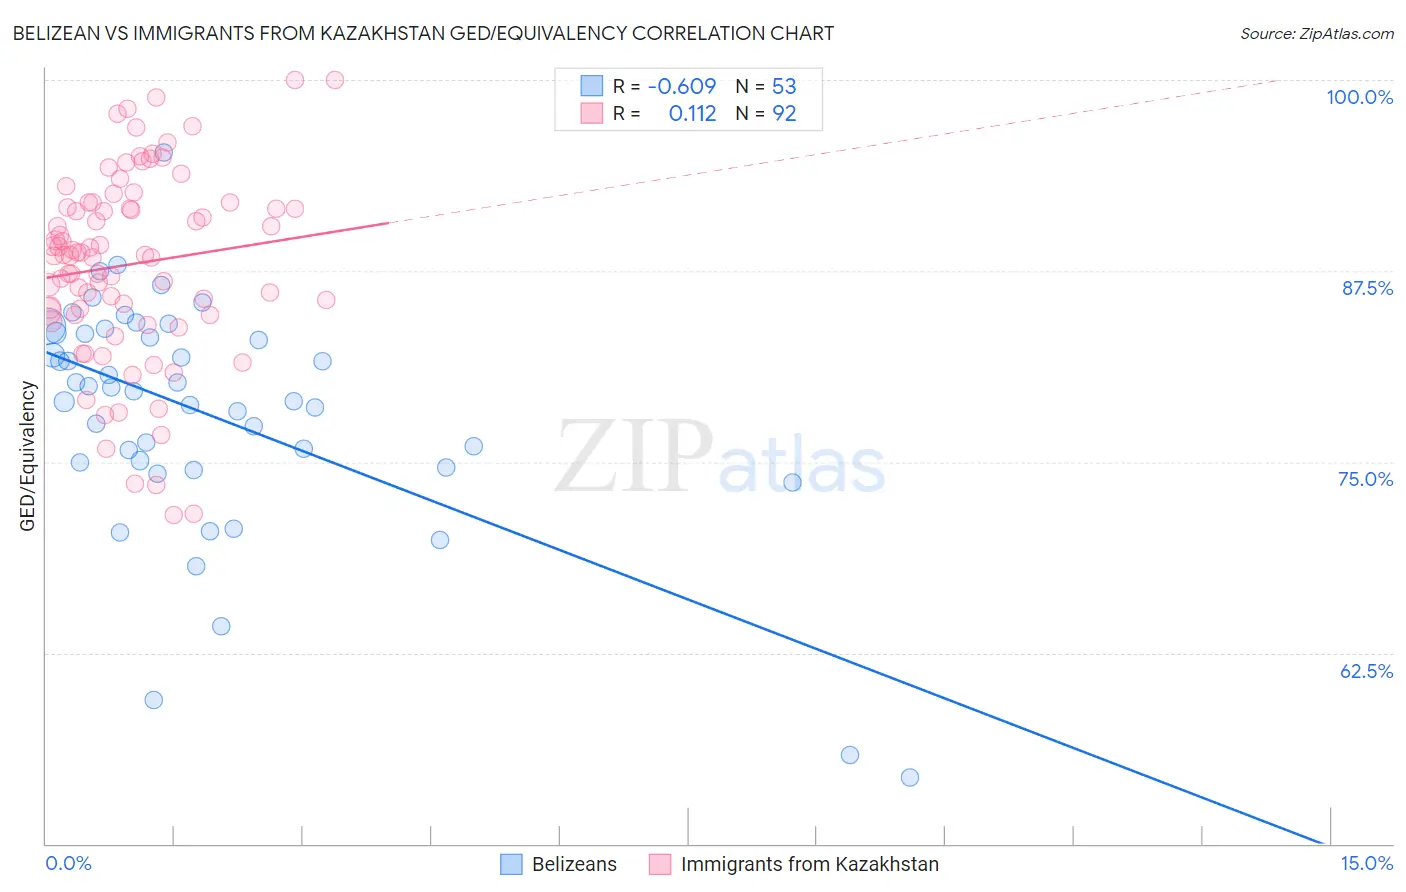
Belizean vs Immigrants from Kazakhstan GED/Equivalency Correlation Chart
The statistical analysis conducted on geographies consisting of 144,224,111 people shows a significant negative correlation between the proportion of Belizeans and percentage of population with at least ged/equivalency education in the United States with a correlation coefficient (R) of -0.609 and weighted average of 80.9%. Similarly, the statistical analysis conducted on geographies consisting of 124,444,172 people shows a poor positive correlation between the proportion of Immigrants from Kazakhstan and percentage of population with at least ged/equivalency education in the United States with a correlation coefficient (R) of 0.112 and weighted average of 87.0%, a difference of 7.6%.
GED/Equivalency Correlation Summary
| Measurement | Belizean | Immigrants from Kazakhstan |
| Minimum | 54.3% | 71.5% |
| Maximum | 95.3% | 100.0% |
| Range | 40.9% | 28.5% |
| Mean | 78.1% | 87.9% |
| Median | 79.6% | 88.5% |
| Interquartile 25% (IQ1) | 74.8% | 84.8% |
| Interquartile 75% (IQ3) | 83.4% | 91.8% |
| Interquartile Range (IQR) | 8.6% | 7.0% |
| Standard Deviation (Sample) | 7.8% | 6.2% |
| Standard Deviation (Population) | 7.7% | 6.2% |
Similar Demographics by GED/Equivalency
Demographics Similar to Belizeans by GED/Equivalency
In terms of ged/equivalency, the demographic groups most similar to Belizeans are Nicaraguan (80.9%, a difference of 0.020%), Cape Verdean (80.9%, a difference of 0.020%), Immigrants from Guyana (81.0%, a difference of 0.060%), Native/Alaskan (80.9%, a difference of 0.060%), and Immigrants from Ecuador (81.0%, a difference of 0.13%).
| Demographics | Rating | Rank | GED/Equivalency |
| Immigrants | Dominica | 0.0 /100 | #307 | Tragic 81.1% |
| Puerto Ricans | 0.0 /100 | #308 | Tragic 81.1% |
| Immigrants | Ecuador | 0.0 /100 | #309 | Tragic 81.0% |
| Immigrants | Guyana | 0.0 /100 | #310 | Tragic 81.0% |
| Natives/Alaskans | 0.0 /100 | #311 | Tragic 80.9% |
| Nicaraguans | 0.0 /100 | #312 | Tragic 80.9% |
| Cape Verdeans | 0.0 /100 | #313 | Tragic 80.9% |
| Belizeans | 0.0 /100 | #314 | Tragic 80.9% |
| Apache | 0.0 /100 | #315 | Tragic 80.7% |
| Central American Indians | 0.0 /100 | #316 | Tragic 80.6% |
| Immigrants | Caribbean | 0.0 /100 | #317 | Tragic 80.5% |
| Yaqui | 0.0 /100 | #318 | Tragic 80.5% |
| Immigrants | Belize | 0.0 /100 | #319 | Tragic 80.5% |
| Immigrants | Cuba | 0.0 /100 | #320 | Tragic 80.2% |
| Yup'ik | 0.0 /100 | #321 | Tragic 80.0% |
Demographics Similar to Immigrants from Kazakhstan by GED/Equivalency
In terms of ged/equivalency, the demographic groups most similar to Immigrants from Kazakhstan are Tlingit-Haida (87.0%, a difference of 0.010%), Assyrian/Chaldean/Syriac (87.0%, a difference of 0.010%), Mongolian (87.0%, a difference of 0.010%), Swiss (87.0%, a difference of 0.020%), and Egyptian (87.1%, a difference of 0.060%).
| Demographics | Rating | Rank | GED/Equivalency |
| Icelanders | 95.7 /100 | #107 | Exceptional 87.1% |
| Canadians | 95.6 /100 | #108 | Exceptional 87.1% |
| Immigrants | Eastern Europe | 95.5 /100 | #109 | Exceptional 87.1% |
| Egyptians | 95.3 /100 | #110 | Exceptional 87.1% |
| French | 95.2 /100 | #111 | Exceptional 87.1% |
| Tlingit-Haida | 94.8 /100 | #112 | Exceptional 87.0% |
| Assyrians/Chaldeans/Syriacs | 94.8 /100 | #113 | Exceptional 87.0% |
| Immigrants | Kazakhstan | 94.7 /100 | #114 | Exceptional 87.0% |
| Mongolians | 94.6 /100 | #115 | Exceptional 87.0% |
| Swiss | 94.5 /100 | #116 | Exceptional 87.0% |
| Immigrants | Hong Kong | 93.8 /100 | #117 | Exceptional 86.9% |
| French Canadians | 93.2 /100 | #118 | Exceptional 86.9% |
| Immigrants | China | 93.2 /100 | #119 | Exceptional 86.9% |
| Scotch-Irish | 91.6 /100 | #120 | Exceptional 86.8% |
| Immigrants | Lebanon | 90.9 /100 | #121 | Exceptional 86.8% |